

-
Yes, the S&P 500 Is Climbing a Wall of Worry Right Now
April 27, 2020, 6:45 AMStocks entered last week on a weak note, but smartly dusted themselves off after Tuesday's slide. As the week ended close to unchanged in the S&P 500 futures, what clues does the detailed assessment of their performance and the fundamental situation offer?
Let's start with the index itself, and check the weekly and daily perspectives (charts courtesy of http://stockcharts.com ).
S&P 500 in the Medium- and Short-Run

The week started with a bearish gap and onslaught of the bears. Since Wednesday though, stocks have erased the sizable decline and closed little changed from where they opened.
While the weekly indicators are on their buy signals, the volume isn't really sending strong signals either way. Viewed from the weekly perspective, the rally could be either consolidating prior gains before another upleg, or stalling before turning lower.
Let's check the daily chart to see whether the weekly lower knot is a sign of strength of the bulls or their last gasp attempt to stem the coming decline.

The daily perspective helps refine the broad picture and to choose between the two options above. After Thursday's hesitation at the 50% Fibonacci retracement, stocks retested it, jumped higher and haven't looked back since. It's encouraging for the bulls to see a strong finish to Friday's session that also took prices above the 50-day moving average.
Volume is leaning slightly in support of the bullish case, and the daily indicators are trying hard to shake off their prior bearish overtones. Still in a precarious position though, such posture can support both the upswing continuation or its consolidation.
Only a decisive downswing below the 50% Fibonacci retracement on high volume coupled with prospects of further declines, would change the bullish-to-neutral takeaway. Currently, we see none of that - instead, there's still potential for the rally to go on.
As the S&P 500 struggled at the 50% Fibonacci retracement, we asked on Friday whether stocks have rolled over and:
(...) kept moving down when faced with grim incoming economic and coronavirus news? No, it rather appears to be shaking them off. Stocks are actually quite resilient, just as they were in early April with all the 12-month plus lockdown speculations making the rounds and no economy reopening hopes in sight.
Perhaps this means that the market now actually wants to go higher. Does that mean we have a bull market? While it's encouraging that the market doesn't really sell off on bad news, the present upswing (stabilization at higher levels) may still turn out to be a bullish leg up within a trading range that spans over weeks and potentially months.
The Credit Markets' Point of View
Let's check now the high yield corporate bonds to short-term Treasuries ratio.

The stock upswing isn't confirmed as the ratio is lagging behind. But is the non-confirmation as dire as it might appear at this chart?
Let's overlay the above ratio with the S&P 500 and take a look at the recent past.

In early April, the ratio had also been on a downswing, and on Apr 3 (also Friday, by the way), it hit a new low while stocks didn't. Should the recent history repeat itself, we could be looking at credit markets again leading stocks higher.
Next, let's take a look at the individual performance of high yield corporate bonds (HYG ETF) and short-dated Treasuries (SHY ETF).

Junk corporate bonds closed almost unchanged - they're not leading down. It rather appears they're taking a breather before the next move. There's a very good chance it'll be up.

The fact that short-term Treasuries are overall moving lower in recent days (and not rising sharply as investors seek shelter), tips the scales in favor of an upswing in riskier assets such as corporate bonds or stocks.

The ratio of investment grade corporate bonds to longer-dated Treasuries also speaks in favor of the upswing to continue. Unlike the ratio of junk corporate bonds to short-term Treasuries, it has made a higher low on Friday, and appears ready to break out higher from its bullish flag formation. Seeing it lead in the upswing, is another point in support of higher stock prices.

The ratio of stocks to Treasuries went higher, supporting the notion that risk-on is far from down and out. Should the ratio overcome the April highs, it would bode well for higher stock prices ahead.
Let's dive into the S&P 500 sectors to assess the health of the most recent turnaround.
Key S&P 500 Sectors and Ratios in Focus

Technology is the sector that leads the index both up and down. While the lower volume warrants caution, technology is leading higher, and it can be seen also within its heavy-weight stocks such as Amazon (AMZN), Microsoft (MSFT), Alphabet (GOOG), Apple (AAPL) or even Intel (INTC). On Tuesday, Alphabet's earnings report is scheduled, Microsfoft is slated for Wednesday, and both Apple and Amazon on Thursday.
As technology goes, the S&P 500 goes. And the balance of risks within the sector points higher.

Healthcare is the other engine of the S&P 500 upswing. Again, the bullish price action is marked by the very low volume of Friday's upswing and the extended daily indicators. Just as with technology, continuation of the move higher or consolidation of recent gains, are the most likely scenarios.

Financials don't appear to be willing to decline much further these days. On low volume, they have even turned slighly higher in their tight trading range. In our opinion, they're basing here just as high yield corporate bonds are. Odds are that their next move will be higher.

Given the turmoil in black gold, energy is a bright spot, and an example of a sector that leads the index higher as it closed the week in the black.

Materials also finished the week with a positive result. And just as with energy, the volume differential between their Friday upswing and the average daily volume in the week, wasn't as stark as with the three heavy-weight sectors. Therefore, chances are that technology, healthcare and financials will play catch up over the coming days.

These were our Friday's observations regarding the financials to utilities ratio:
(...) Despite yesterday's S&P 500 decline, financials (XLF ETF) outperformed utilities (XLU ETF). This sends a subtly bullish message as it appears that the ratio isn't really ready to move much lower.
Indeed, financials outperformed, and rejected the intraday move lower. As the financials are farthest away from what we could call an uptrend, this ratio is understandably still weak overall. Seeing it break above the declining resistance line formed by the March and April tops, will be a bullish development. If it breaks below the April lows, it would be a bearish omen. Until it break out in either direction, its implications are rather neutral, and paying attention to financials provides more clues.

The dicretionaries to staples ratio provides more colorful insights. As well, it refused to roll over to the downside, and is slowly but surely marching higher in a gentle nod to the S&P 500 upswing.
The Fundamental S&P 500 Outlook
If we have seen a V-shaped recovery somewhere, it was in the stock market. The hopes and expectations of the economy reopening fuel the run, but will the real economy rebound as the V letter implies? We're of the opinion that just as different states and major cities reopen to varying degrees at different points in time, so will the whole economy move. Currently, a U-shaped recovery is the most probable scenario in our opinion. We don't exclude a W-shaped recovery either, though in that case, the right bottom would likely form above the left bottom of the letter W.
However, this means that stocks are trading at stretched valuations currently, and their reaction to the upcoming key technology companies' earnings, is of key importance. Judging by how the S&P 500 took to this week's reports batch, the takeaway is encouraging. Sure, the unemployment data are dismal, Great Depression-like - and we see it cascading well beyond the usual corona-impacted suspects such as airlines, tourism and the like. The brick-and-mortal retail was on the ropes even before the pandemic played into the Amazon hands. Yes, big business is downsizing and many small businesses won't reopen.
As the economic destruction is unprecedented, central banks don't stand idle. And they won't in the future either. Joined by fiscal policy moves, how long will it take for another stimulus package to hit the waves? It must be in the works already.
Let's keep in mind that we're trading the stock market, and not the real economy. We have to watch the S&P 500 price action and money flows. Once the sharp sell-off ended in late March, it's not out of the unexpected to see a reflexive rally up to the 50% Fibonacci retracement. Even dead cats bounce.
But we've seen quite a few rejections of prices returning back lower. The upswing certainly hasn't been reversed to the downside, and while the breakout above this retracement hasn't been confirmed by three consecutive closes yet, there are encouraging signs that it would continue upwards.
Will people take profits as prices approach the nearest strong resistances such as the 61.8% Fibonacci retracement or the early March bearish gap? The best we can do is to look at the money trail not merely on a day-to-day basis - should it deteriorate (coupled with warning signs from the S&P 500 sectoral analysis), it would be the best signal available to get out of our increasingly profitable long positions.
No one has a crystal ball and can say with 100% certainty that this or that, major or minor, resistance will hold. It's in the context and overall interpretation of all the above-discussed signals that the market sends. Plus the fundamental developments and headlines. The rally can both go higher, and still roll over to the downside in the coming weeks or months in a challenge of the 2200 lows. By the same token, the lows might be already in. The point is we have to trade the situation in the now, because there are so many moving parts to discount in the price. That's for the present - and don't forget about the unknown unknowns that will strike down the road either.
The current outlook is bullish but we have to stay nimble and continually ask ourselves whether our long position keeps making sense. Right now, it does.
From the Readers' Mailbag
Q1: Do you see this bull run breaking down at 2880 or the 2930 .618 Fib? Last couple of days felt very weak especially on volume.
Q2: Do you still hold a downside target of 2200? I'm concerned with how far VIX fell today. Do you foresee it breaking above 2840 and 2880?A: Please see the above three paragraphs for your answers.
Q: What do u think about S&P 500 pe ratio topping February's peak?
A: Sure, as earnings go down, the valuations are getting stretched. Yet the market looks over the valley and discounts the upcoming quarterly earnings, which means that the P/E ratio can still get ridiculously high if you consider real economy developments. But we've seen this in the Great Recession as well. Paying too much attention to the P/E ratio is best left to long-term investors. In the current environment, one has be flexible and ready to act on the many above-described technical indicators. We're not in a buy-and-hold environment.
Summary
Summing up, S&P 500 closed the week back above the 50% Fibonacci retracement. While Friday's upswing happened on lower volume (making it less credible), the key sectors and their ratios (financials to utilities, and especially discretionaries to staples) favor the upswing attempt to continue. Credit markets seem to be making a local bottom, and financials may be already acting on that. The ease with which bad news (economic or corona-related) are ignored, gives the bulls the benefit of (perhaps even more than) a short-term doubt. Stocks appear to be ready to move higher and our Thursday-initiated long position remains justified. Today's premarket upswing points to a bullish gap at the open, lending further support to the bulls.
If you enjoyed the above analysis and would like to receive daily premium follow-ups, we encourage you to sign up for our Stock Trading Alerts to also benefit from the trading action we describe - the moment it happens. The full analysis includes more details about our current positions and levels to watch before deciding to open any new ones or where to close existing ones.
Thank you.
Monica Kingsley
Stock Trading Strategist
Sunshine Profits - Effective Investments through Diligence and Care -
S&P 500 Climbing the Wall of Worry?
April 24, 2020, 7:42 AMStocks appeared to be making a decisive move higher yesterday, and then a sharp move lower struck. Did it have a catalyst, and if so, what can we make out of today's premarket upswing? How does it reflect on the technical outlook for stocks?
Let's start with the S&P 500 daily chart (charts courtesy of http://stockcharts.com ).
S&P 500 in the Short-Run

Negating Wednesday's selling just before the close, S&P 500 opened higher yesterday. The buyers kept adding to their gains, and then prices just rolled over. In the fundamental part of today's Alert, we'll discuss the catalyst. The selling pressure shows as the upper knot with a close at the daily lows in yesterday's candle.
To count as a meaningful reversal though, the volume could have been bigger to make it credible. This way, it can just as easily be a news-driven daily selloff that extends the consolidation before stocks take on the nearest set of resistances again.
Yes, S&P 500 is struggling around the 50% Fibonacci retracement at the moment. But has it rolled over and kept moving down when faced with grim incoming economic and coronavirus news? No, it rather appears to be shaking them off. Stocks are actually quite resilient, just as they were in early April with all the 12-month plus lockdown speculations making the round and no economy reopening hopes in sight.
Perhaps this means that the market now actually wants to go higher. Does that mean we have a bull market? While it's encouraging that the market doesn't really sell off on bad news, the present upswing (stabilization at higher levels) may still turn out to be a bullish leg up within a trading range that spans over weeks and potentially months. Therefore, we're not calling it a bull market.
Remember, stocks aren't yet trading back above the 50% Fibonacci retracement on a closing basis. Once they do, and also take out both the 61.8% Fibonacci retracement and the early March bearish gap with ease, that would be what we're looking for. Combine that with the stocks to Treasuries ratio going higher, these would be the essential preconditions. For good measure, let's have it supported by favorable sectoral internals of the advance too.
Such was the snapshot of stock market health in the unfolding upswing that we've shared within our yesterday's intraday Stock Trading Alert. It justified doing away with the hedge and keeping only the long part of the trade intact:
(...) While the S&P 500 upswing might seem not to be overly dramatic so far, it's the internal health of it and the accompanying credit market performance that is catching our eye.
Let's start with the S&P 500 sectors - technology (XLK ETF) is holding much of today's gained ground, healthcare (XLV ETF) is doing even better and the financials (XLF ETF) appear to be forming a base. Even hard-hit energy (XLE ETF) is going higher while materials (XLB ETF) appear ready to move up some more. This would be confirmed by the consumer discretionaries to staples ratio's peek higher as it's also utilities (XLU ETF) that are struggling at the moment. These are favorable conditions for the financials to utilities ratio to move up down the road as well.
In conclusion, the above factors would point to a budding transition to the risk-on sectors in the S&P 500 rally.
As for credit markets, high yield corporate bonds (HYG ETF) appear to be readying for an upside move while municipals (HYD ETF) are stalling and investment grade corporate bonds (LQD ETF) are moving gently higher. In contrast, longer-dated Treasuries (IEI ETF) are struggling to recover ground lost yesterday as short-term Treasuries (SHY ETF) are looking to extend their decline.
In conclusion, these point to improving financial conditions and supports increased risk appetite - all in the absence of additional Fed support, which has been actually gradually tapered over the preceding weeks. To see the markets move higher in such circumstances, is encouraging, especially since there's no stock selloff as the almost $500bn aid package has become a virtual certainty.
That's a bullish constellation at least for the short-term.
Let's dig into the key details now that we are armed with yesterday's closing prices.
The Credit Markets' Point of View

High yield corporate bonds (HYG ETF) didn't break down yesterday. Neither did their ratio to short-term Treasuries (SHY ETF). As they've been consolidating over recent sessions, a bigger move appears to be at hand. Arguably, the more time it takes without HYG declining, the better the chance for their rebound higher.
Would an examination of the stock market itself to Treasuries help?

This metric shows the rejection of yesterday's S&P 500 upswing more clearly. Still though, we haven't seen any breakout. It's just a congestion out of which one might very well develop as the pressure to go higher appears to be building up.
Can the S&P 500 sector ratios sharpen the picture that the credit markets are leaving relatively blurry?
Key S&P 500 Sector Ratios in Focus

Despite yesterday's S&P 500 decline, financials (XLF ETF) outperformed utilities (XLU ETF). This sends a subtly bullish message as it appears that the ratio isn't really ready to move much lower. Should we see it breaking above the declining resistance line formed by the March and April highs, that would result in an entirely different takeaway - a bullish one.
As we're not quite there yet and therefore can't really act on such a possibility, what about the consumer discretionaries to consumer staples ratio?

This one has already moved out of its congestion. As it was to the upside, that's a bullish sign. It's almost at the very early March highs, and definitely higher than was the case later throughout both March and April. It points to the bulls not having given up.
The Fundamental S&P 500 Outlook
It's high time to discuss yesterday's breaking news that helped to move S&P 500 down. It was the Chinese report on the first randomized clinical trial of Gilead's Remdesivir, the supposed silver bullet. As it flopped, hopes were dashed - though Gilead objected to the study's early termination, calling it inconclusive. In light of such news, it's truly encouraging that the S&P 500 futures are now (well before 7 am Eastern Time) attacking the 2800 handle again.
In other news, it's promising to see NYC residents' immune systems at work, as full 14% may already have coronavirus antibodies. As this Swedish study shows, this may be the case for up to a third of Stockholmers too. This builds on our yesterday's points regarding the relaxed approach that Belarus also takes.
Keeping an eye on such developments will help us assess the prospects of US economy reopening, and the degree thereof. These are vital clues for the stock market, and naturally, we expect the rural parts to be the first to open up. Just when will the key cities join, and what kind of shape will the consumer be by then, is the $64,000 question.
Summing up, while the S&P 500 suffered a setback yesterday, the bullish case is far from lost. Overnight, prices returned to trading back above the 50% Fibonacci retracement. The key sectoral ratios (financials to utilities, and especially discretionaries to staples) favor the upswing attempt to continue. Credit markets aren't sending a warning sign on a day-to-day basis. The ease with which bad news (economic or corona-related) are ignored, gives the bulls the benefit of (perhaps even more than) a short-term doubt. Stocks appear to be ready to move higher and our long position remains justified.
If you enjoyed the above analysis and would like to receive daily premium follow-ups, we encourage you to sign up for our Stock Trading Alerts to also benefit from the trading action we describe - the moment it happens. The full analysis includes more details about our current positions and levels to watch before deciding to open any new ones or where to close existing ones.
Thank you.
Monica Kingsley
Stock Trading Strategist
Sunshine Profits - Effective Investments through Diligence and Care -
Another Day, Another S&P 500 Reversal
April 23, 2020, 10:01 AMBucking Tuesday's breakdown below the 50% Fibonacci retracement, stocks have pushed higher yesterday to return back around this key resistance level. The bears have suffered a setback yesterday, but it proved important to wait for the session close in order to assess the damage. Does it mean that the bulls just got their act together?
Let's start with the S&P 500 daily chart (charts courtesy of http://stockcharts.com ).
S&P 500 in the Short-Run

The buyers countered with their own bullish gap yesterday, and slowly but surely took prices higher throughout the day. Yet again, there was a telling twist to the session's tone. That's how we described it yesterday:
(...) The final 30 minutes show that just as on Monday, there was a bearish close to the session. That's the opposite of last week's action before the closing bell, and a bearish omen for the near term.
That's in line with the heavy selling we saw in the final 15 minutes of yesterday's trading. The resulting daily candle thus has a relatively sizable upper knot.
The barely noticeable change in the daily indicators means that the following observations regarding Tuesday's downswing, remain valid:
(...) the daily indicators' posture has clearly deteriorated. While that's encouraging for the bears, it may still take a while for the downswing to accelerate. Actually, it might take a pause as there's one good fundamental reason for it.
(...) As for fiscal policy news, the Senate approved almost $500bn small business and hospitals' aid package yesterday.
As the new stimulus is making its way through the House, the S&P 500 futures' reaction remains muted. It's that both the daily indicators and the volume comparison between yesterday's upswing and Tuesday's downswing, are sending a mixed picture of interim indecision.
Having said that, let's see whether the credit markets bring more clarity to the table.
The Credit Markets' Point of View
The above chart show high yield corporate bonds (HYG ETF). They haven't materially recovered from Tuesday's decline, and neither has their ratio to short-term Treasuries. Short-term Treasuries (SHY ETF) are holding up, while longer-term ones (IEI ETF) retreated from their highs. While it might be constructed as a bullish omen for stocks, such a conclusion based on one daily decline, wouldn't hold water just yet as IEI is far from breaking down.
Judged by the daily indicators and very low volume of yesterday's HYG upswing, the ETF appears consolidating before another move lower. And that doesn't bode well for stocks marching higher.
Let's dig into the S&P 500 sectors and their ratios next.
Key S&P 500 Sector Ratios in Focus

Can an S&P 500 rally be internally strong when the financials (XLF ETF) don't enthusiastically participate? The ratio of their performance to utilities (XLU ETF) reveals just how badly they are lagging behind, both in relative and absolute terms. This doesn't really point to a broad return of bullish spirits.
What about the consumer discretionaries to consumer staples ratio?
As it's keeping near the recent highs, it shows the bulls haven't given up and actually place faith with the consumer recovering shortly. But will retail sales come back strongly in May? We doubt that. This leading, risk-on ratio is still trading below both the early- and late-March highs. In other words, there has been no breakout that would help push the S&P 500 higher than it is now. This warrants caution in getting too optimistic, and stubbornly high Treasuries concur.
But how did the heavy-weight S&P 500 sectors do yesterday?
Technology (XLK ETF) almost made it to Monday's closing prices before pulling off. Healthcare (XLV ETF) lagged behind and closed essentially where it had opened on Tuesday. And financials (XLF ETF) gave up half of their opening gap's gains.
Overall, such action shows that yesterday's upswing isn't as strong as it appears at first sight. As a result, it's not possible to draw bullish conclusions based on that session alone.
The Fundamental S&P 500 Outlook
Today's contribution will take aim at the coronavirus status and progress, dealing with the dilemma between lockdown relaxation because of the economy. and the epidemiological facts.
The official coronavirus death count in the US shows that the optimism coming from the plateauing curve, was premature. The incoming data from Sweden show that the country just overtook both the US and Switzerland on deaths per capita basis. While the effort to remain open for business and to leave social distancing discipline to individual responsibility and not to a government-issued mandate is laudable, it highlights the challenges on the way to achieving true herd immunity by natural means.
That's an argument against significant lockdown relaxation and economy reopening that the countries that have pursued the stern route will surely make. On the other hand though, it's becoming increasingly broadly voiced that the vaccine isn't a silver bullet either due to the many Covid-19 mutations observed so far and still to come. Arguably, the situation will turn out similar to the flu vaccine that is in essence making an educated guess what flu strains will be predominantly in circulation this or that season. And educated guesses can and do backfire, as we've seen with flu vaccines as well.
Striking the balance between the primary need for the economy to come back to life, and managing the coronavirus outbreak, is the highest call. It's so easy to understand and sympathize with the anti-lockdown protesters but they would help the cause of freedom more if they followed as many social distancing principles as possibly reasonable (yes, face masks are a minimum). The virus is real, and needs to be taken seriously. The choice is not either the economy, or to throw caution to the wind. Both the economic and societal recovery is a long way off, and neither comes in a V-shaped form.
Look, China just placed Harbin, a city of 11 million, under lockdown because of one asymptomatic carrier that after having spent 14-days in quarantine and being trouble-free, still inadvertently managed to infect 70 other people. Logically, if they had judged prior draconian lockdowns as essential to bring the situation more or less under control, it's that probably it was the least painful solution in the short-term.
Meanwhile, the weekly unemployment claims just arrived. At almost 4500K again, it's an understatement to say that the economic pain is sizable. Yet with so many lives and livelihoods at stake, the S&P 500 futures are attempting to shake it off and cross back above 2800.
Are they attempting to climb a wall of worry?
Judging by the market action at the open, it appears to be the case as the futures have reached 2820. Such momentum makes it likely that the upswing will go on later today.
When examining yesterday's Gold & Silver Trading Alert's perspective, we concluded that the upswing doesn't pose danger to the breakdown below the rising support line. Let's check today's chart and assessment from the said Alert:
(...)
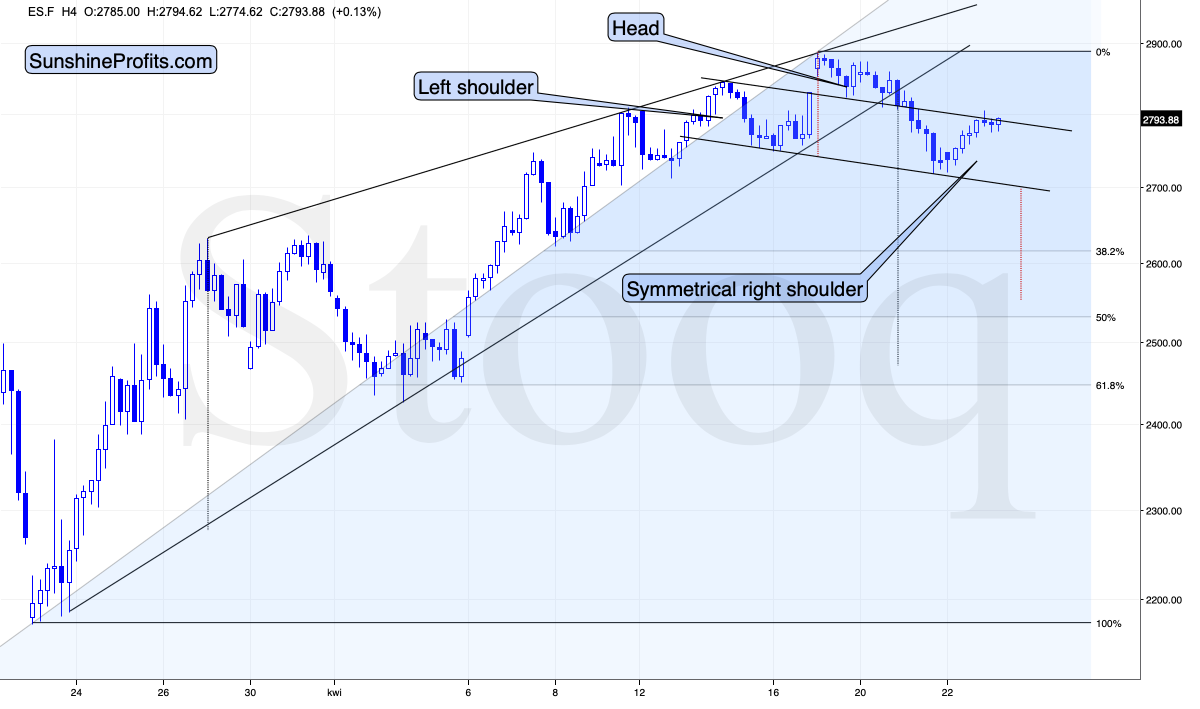
Stocks moved higher yesterday, but they were very far from invalidating their recent breakdown below the rising support line. Instead, the rally stopped at the line that's parallel to the neck level of what could become a head and shoulders pattern. Creating such lines allows us to see how high should a given market rally for the pattern to be symmetrical. These patterns don't have to be perfectly symmetrical, but quite often they tend to be.
Of course, the head-and-shoulders pattern is in progress and not completed yet, but by the same token, it's far from being invalidated.
What would be a prudent course of action given all the above?
We're of the opinion that opening a short-term hedging position on the long side is justified. The full position details are reserved for our subscribers.
From the Readers' Mailbag
Q: What does the candle stick we hit today mean? Looks almost like a doji star? 2 bearish candle sticks followed by a green doji star i couldn't find anything to compare it to. I'm assuming bearish because we closed pretty close to the open?
A: Yesterday's candle just goes to show the tug-of-war between the buyers and the sellers when their forces are relatively balanced in the very short-term. To say so with any degree of confidence, one has to look at the context and not an individual candlestick. While that's still important, it's the context that gives it meaning. Even within candlesticks, there are formations that involve just one, or several recent ones.
Anyway, the point is to tip the scales in this high-probability game in our favor. Does the shape of yesterday's candle decidedly do so? No, but coupled with the daily volume and swing highs and lows examination, it's another piece in the puzzle of where might stocks go most probably next.
Remember, diligent money management and working patiently with an edge as you evaluate your currently open trade, is what counts.
If you had no position open, would you be in that trade that you're currently in? If so, then keeping the position open makes sense. Even if the open position temporarily goes nowhere, you never know what would be the catalyst of the most probable upcoming move. Actually, there might not even need to be one.
Summing up, the S&P 500 retraced quite a part of Tuesday's declined, making the very short-term outlook rather neutral but with strong bearish undertones. As prices returned to trading around the 50% Fibonacci retracement, and are attempting to move above it again today, the credit markets continue to underperform. As the key sectoral ratios are leaning bearish, they still hint at the need to be patient and let the April upswing run its course and be recognized as over. While that hasn't happened yet, the coronavirus death count is rising again after a short reprieve (where does that leave the reopening?), new unemployment claims remain off the charts with manufacturing, retail sales, consumer confidence and the like more likely to take it on the chin than not. While the balance of risks favors a move to the downside to continue, and thus our short position would remain justified, stocks appear on the verge of another short-term upswing to capitalize on.
If you enjoyed the above analysis and would like to receive daily premium follow-ups, we encourage you to sign up for our Stock Trading Alerts to also benefit from the trading action we describe - the moment it happens. The full analysis includes more details about our current positions and levels to watch before deciding to open any new ones or where to close existing ones.
Thank you.
Monica Kingsley
Stock Trading Strategist
Sunshine Profits - Effective Investments through Diligence and Care -
The S&P 500 Bulls Are Readying Their Response
April 22, 2020, 9:39 AMStocks have invalidated their breakout above the 50% Fibonacci retracement. Apart from this key development, what else can we deduce from yesterday's price moves around stocks? And in light of today's premarket upswing, would these indications stand the test of time later today?
Let's start with the S&P 500 daily chart (charts courtesy of http://stockcharts.com ).
S&P 500 in the Short-Run
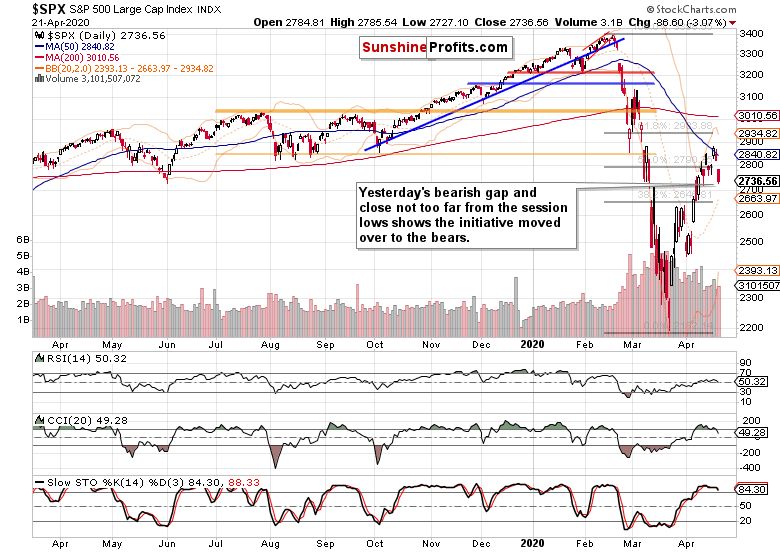
Prices opened with a sizable bearish gap and no serious attempt to deal with it to speak of. With the sellers on the initiative, stocks kept moving lower throughout the session despite two intraday attempts to retrace a portion of the preceding decline. The final 30 minutes show that just as on Monday, there was a bearish close to the session. That's the opposite of last week's action before the closing bell, and a bearish omen for the near term.
With yesterday's downswing, the daily indicators' posture has clearly deteriorated. While that's encouraging for the bears, it may still take a while for the downswing to accelerate. Actually, it might take a pause as there's one good fundamental reason for it, and we'll discuss it further on.
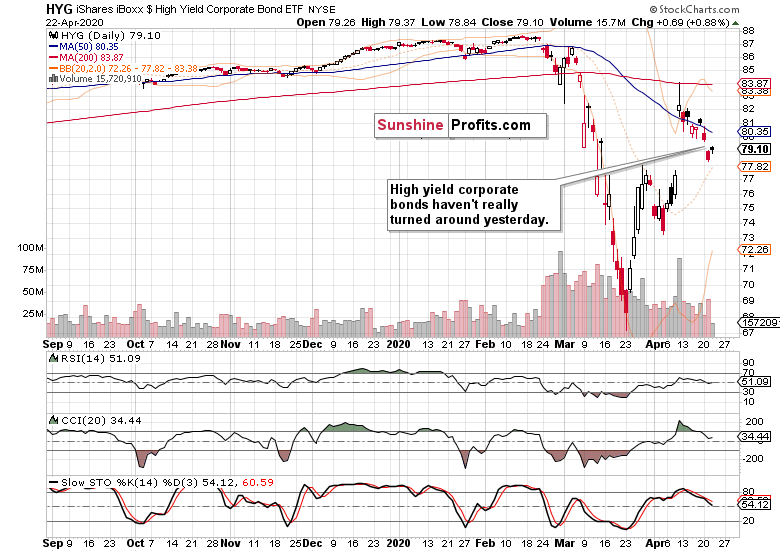
Let's check the key credit markets' metric next. Despite the Fed's scope of interventions having broadened earlier this month to include corporate credit instruments as well, the message has to be reckoned with. As we looked into the Fed's move in real-time, we've highlighted the waning bang for a buck that this intervention has bought in the many credit markets. So, how is the high yield corporate bonds to Treasuries ratio doing?
The Credit Markets' Point of View
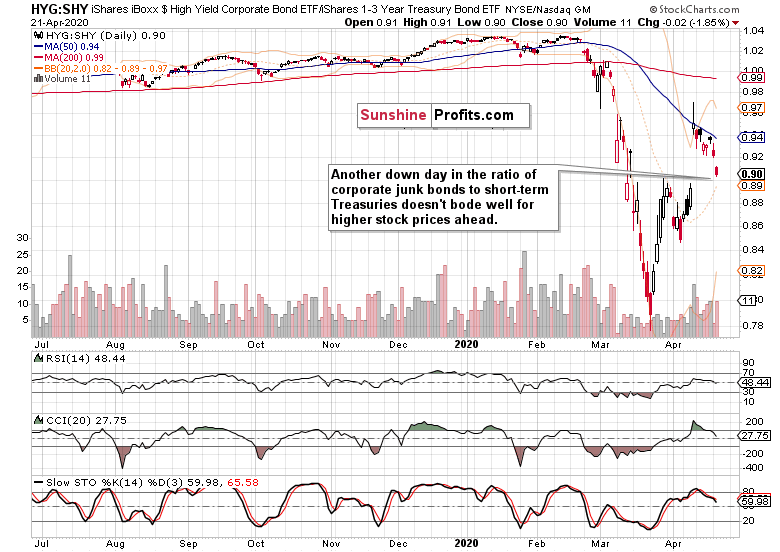
Another bearish gap and another move lower that's driven by the high yield corporate debt (HYG ETF) decline that happened on high volume to top it off. Our yesterday's point about the defensive nature of the preceding S&P 500 rally remains valid. Simultaneously, we've mentioned the strong showing of the technology sector (XLK ETF).
Once we check its yesterday's performance, we'll examine the financials (XLF ETF) as they could be reasonably expected to move up in light of the much-touted yesterday's fundamental news.
Technology and Finance in Focus
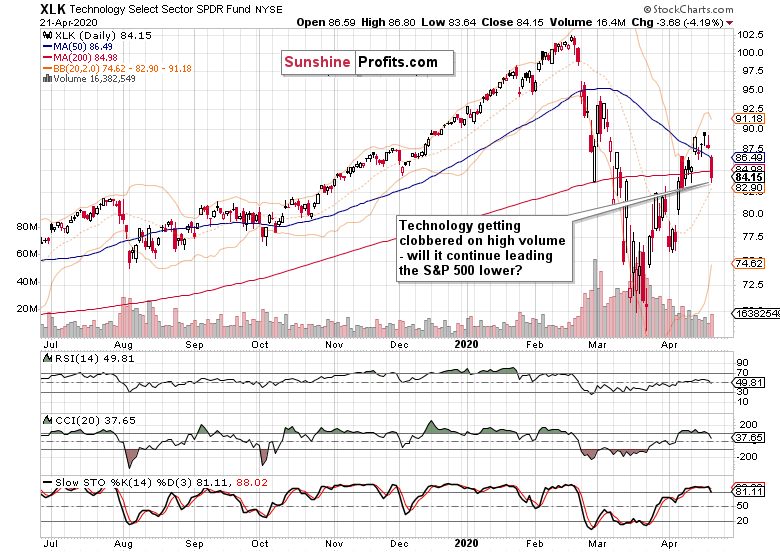
The sizable bearish gap and intraday momentum on relatively high volume doesn't paint a bullish picture for the days to come. Will the bulls be able to mount a strong response and close yesterday's gap?
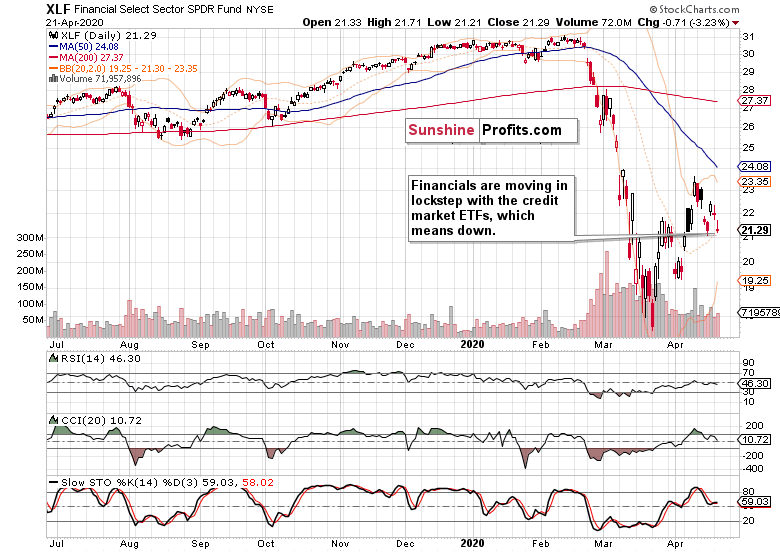
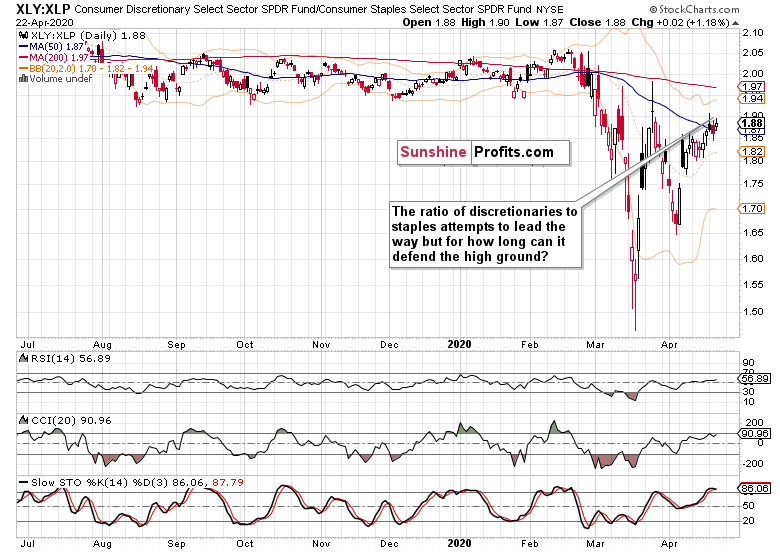
Financials gave up their early gains and closed near the daily lows. The overall intepretation of the daily indicators' message is rather neutral (in other words, not precluding a short-term upswing) but over the medium term, the risks to the downside remain higher than to the upside.
The Fundamental S&P 500 Outlook
Yesterday, we've expanded Monday's flagship Stock Trading Alert's perspectives with the examination of the monetary policy outlook for this week. As for fiscal policy news, the Senate approved almost $500bn small business and hospitals' aid package yesterday. Yet that didn't help the financial sector, and neither healthcare (XLV ETF) benefited.
Is today's premarket upswing reaching 2775 a case of buy the rumor and sell the news?
We're of the opinion that today's upswing is going to run out of steam shortly, and won't materially change the below perspective as described in today's Gold & Silver Trading Alert:

(...) In Tuesday's analysis, we wrote the following two paragraphs about the breakdown below the rising support line:
The breakdown below these lines is a major bearish sign and something that is likely to lead to further deterioration in the stock market. As the protests against the lockdown keep popping up, the odds for the end of the lockdown actually decreased, as people participating in the protests usually don't wear masks and don't adhere to the social distancing rules. The same with Florida beaches. And there are countries when things are even worse with regard to social distancing violations.
All this increases the news-based odds for a decline in the stock market and a rally in the USD Index. However, the above chart - and the breakdown - provide the technical evidence that the next decline is quite likely already underway.
Wednesday morning, we see that the breakdown did indeed lead to lower stock market values. Stocks have now paused at one of their previous lows, but it doesn't seem that this low would be able to hold the decline for much longer.
What is not clear at first sight, but is actually important, is that stocks are now moving back and forth below the April 7 high. Once the breakdown is verified, we should see a quick slide to the following low that coincides with the Fibonacci-based retracements - at about 2,630. The next stop would be the April lows that coincide with the 61.8% Fibonacci retracement at about 2,440.
As the S&P 500 futures are trading at around 2775 currently, that's well above the April 7 high. It's highly likely though that this bounce just anticipates the fiscal policy move and doesn't pose danger to the breakdown below the rising support line. In other words, the breakdown stands a very good chance of not being invalidated.
Summing up, the S&P 500 rolled strongly over to the downside, and the bulls are staging a rebound as we speak. On one hand, we have the Fed's taper of asset purchases, on the other, there is the new fiscal stimulus making its way through Congress. The breakout above the 50% Fibonacci retracement has been invalidated, and today's upswing hasn't changed that. The credit markets continue to underperform, and the formerly leading S&P 500 sectors have moved decidedly lower yesterday. The S&P 500 bulls are likely to remain on the defensive throughout the week as the coronavirus death count is rising again after a short reprieve (where does that leave the reopening?), and a new batch of earnings strikes today (unemployment and manufacturing data will do so tomorrow). The balance of risks favors a move to the downside to continue, and our short position remains justified.
If you enjoyed the above analysis and would like to receive daily premium follow-ups, we encourage you to sign up for our Stock Trading Alerts to also benefit from the trading action we describe - the moment it happens. The full analysis includes more details about our current positions and levels to watch before deciding to open any new ones or where to close existing ones.
Thank you.
Monica Kingsley
Stock Trading Strategist
Sunshine Profits - Effective Investments through Diligence and Care
Free Gold &
Stock Market Newsletter
with details not available
to 99% investors
+ 7 days of Gold Alerts
Gold Alerts
More-
Status
New 2024 Lows in Miners, New Highs in The USD Index
January 17, 2024, 12:19 PM -
Status
Soaring USD is SO Unsurprising – And SO Full of Implications
January 16, 2024, 8:40 AM -
Status
Rare Opportunity in Rare Earth Minerals?
January 15, 2024, 2:06 PM

