

-
The Opening Salvo in the S&P 500 Downswing
May 4, 2020, 6:41 AMThursday's bullish run into the closing bell evaporated faster than you could say Jack Robinson. On the heels of the Amazon (AMZN) earnings disappointment, stocks slid during the overnight session, opening subdued across the board. The glimmer of hope offered by stronger than expected ISM Manufacturing PMI data proved short-lived, and gave us an opportune entry point to exit the prior long position on better terms, and simultaneously open the new and immediately profitable short position.
S&P 500 in the Medium- and Short-Run
We'll start this week’s flagship Stock Trading Alert with the weekly chart (charts courtesy of http://stockcharts.com ):

The long upper knot shows how far the rally has reached over the week, almost touching the 50-week moving average. However, prices reversed sharply lower, and did so on higher volume than was the case throughout the preceding upswing. That's a bearish omen.
Let's check the daily chart to see how the story of decelerating weekly indicators is most likely to proceed.

The sizable bearish gap at the open drove prices lower in the following hours regardless of the positive manufacturing surprise. It's true that Friday's volume has been lower than that of Thursday's reversal with the comeback attempt to the 61.8% Fibonacci retracement. Does that mean the downswing is running out of steam?
In all likelihood, the lower volume just shows that a larger move is underway, and that the bulls don't find the setup interesting enough to step in and buy with conviction. Similarly the bears don't find it a good time or place to get out of their positions just yet.
As the daily indicators are overwhelmingly in accord with the downtrend's chances to continue, which areas could prove an obstacle for the sellers?
The 50% Fibonacci retracement at around 2790 is the closest at hand, but we don't expect it to be overly strong at stopping the bears. Depending on the momentum and time it gets to reach, the 2750-2720 area might prove stronger. This is the area marked by the 50-day moving average on its upper end and previous local lows on the lower end.
Depending on the technical signals we get along the way, we'll be able to better assess how far the downswing could go, and make appropriate trading decisions.
With that in mind, let's check the debt markets.
The Credit Markets' Point of View

High yield corporate debt turned lower, in unison with the declining stocks. And so did its ratio to short-term Treasuries (HYG:SHY). Is the message from investment grade corporate bonds (LQD ETF) any better?

Not really, and this better-rated corner of the corporate debt world, is actually leading the downside move. And again, so is its ratio to the longer-dated Treasuries (LQD:IEI).
Unless both ETFs' moves lower are reversed, the credit markets aren't really on the bulls' side right now.
Key S&P 500 Sectors in Focus

The tech sector tried hard to erase the opening losses, but just could close Friday's gap. Just as the S&P 500, it closed near its lows on respectable volume, giving the coming move lower a pretty good chance of continuing. The daily indicators are rolling over to the downside, supporting the downswing.

Healthcare mirrors the action in tech quite well, with the exception of an attempt to close Friday's bearish gap. As this was near to nonexistent in this sector, it subtly speaks in favor of more downside to come - just as the daily indicators' sell signals do.
As the credit markets' standing has deteriorated, how much was it reflected in the financials?

The financials' outperformance is over, and the sector has moved steeply lower. Thanks to the position of the daily indicators, the downswing has a good chance to continue as well.
Next, we'll examine the stealth bull market trio of sectors that are supposed to lead the index higher, if we are in a bull market, that is. So, let's check energy (XLE ETF), materials (XLB ETF) and industrials (XLI ETF).

Energy clearly reversed, and its relative strength (or lack thereof) as we see the S&P 500 going lower, will be an important signal in assessing the health of the decline and prospects for upside reversal. For now, there's been no sign of strength on Friday.

A similar conclusion can be reached from the materials examination. While they held up better throughout the day (just like consumer discretionaries, the XLY ETF, did), it'll likely prove to be of fleeting nature only (in both cases).

And that's also true with industrials, where the weakness was more along the lines of energy. Plain obvious, that is.
Overall, this mix shows that there can be no talk of a local bottom being reached. The S&P 500 downswing has its ducks ligned in a row right now.
The Fundamental S&P 500 Outlook
Early in the week, the bulls enjoyed earnings reports that beat expectations among the tech heavyweights. That however changed with Thursday's aftermarket Amazon (AMZN) release - it's notable, how easily could the whole of its Q2 projected profit get gobbled up by coronavirus-related expenses, as they foresee it would.
The reopening euphoria has run against the wall as about half the States have partially reopened their economies. The epidemiological situation is improving in some areas while deteriorating in others, underscoring that jumpstarting the economy would be a long process. As we noted in our April 12 Stock Trading Alert, while there is a legitimate desire to get the economic life going again, these factors are to be counted with:
(...) 1. the stress and damage to the supply chains
2. consumer confidence and lifestyle habits
3. small and medium business capacity to absorb the shocks
4. the ability to buy time and soften the blow via monetary and fiscal interventions
Going into Friday's trading, the Trump finger pointing on China for coronavirus raised fears about the trade war that took a backseat to the pandemic. Understandably, not even the high hopes placed in remdesivir getting the emergency use authorization, could turn the sentiment.
Fundamentally, we expect the stock market to reassess its overly optimistic prospects against the economic impact on the ground. Stock valuations are likely to be viewed as extended, and this supports the bearish bias over the coming sessions.
From the Readers' Mailbag
Q: What would you think would be the next level down on the SP 500? 2793 - the 50% FIB retracement from the lows? or 2652 - the 38,2% retracement?
A: The 50% Fibonacci retracement is within spitting distance, and in the course of the S&P 500 daily chart analysis, we've discussed an area in between these two retracements that we expect to give the bears a harder time than the 50% Fibonacci retracement. Throughout the move, we'll be monitoring the sectoral strength, their ratios, and the credit markets, for these will give us an idea how far the current downswing can actually reach. We think that we're in the opening stages thereof, and that our open profits will keep growing before it's justified to close the trade.
Q: Should I buy at around 2600?
A: It's too early to say that, as the above points about credit markets, sectoral strength, ratios and fundamental developments apply whatever numerical target we discuss. Together, they'll form the basis for our upcoming trading decision, and yes, stocks declining to the low 2600s is one of the preliminary scenarios or hypothesis if you will.
Summary
Summing up, stock rolled over almost all the way down to the 50% Fibonacci retracement, highlighting the significance of the reversal from the 61.8% Fibonacci retracement. The credit markets support the downswing, and so does the broad sectoral analysis. We're in the early stages of the S&P 500 downswing and our open and profitable short position is amply justified.
If you enjoyed the above analysis and would like to receive daily premium follow-ups, we encourage you to sign up for our Stock Trading Alerts to also benefit from the trading action we describe - the moment it happens. The full analysis includes more details about our current positions and levels to watch before deciding to open any new ones or where to close existing ones.
Thank you.
Monica Kingsley
Stock Trading Strategist
Sunshine Profits - Effective Investments through Diligence and Care -
How Much Lost Ground Can the S&P 500 Bulls Recover?
May 1, 2020, 7:00 AMStocks couldn't build on Wednesday's gains, and the bulls had to face selling pressure during yesterday's regular session. While they've dealt with a good part of the intraday downswing, they couldn't close the opening bearish gap. How does the bullish case look at the moment?
S&P 500 in the Short-Run
We'll open this section by quoting from today's intraday Stock Trading Alert that we've posted prior to this regular article (charts courtesy of http://stockcharts.com ):
(...) S&P 500 opened lower yesterday, and despite the selling pressure during the session, prices held up relatively well. Having closed at 2912, the breakout above 61.8% Fibonacci retracement has been however rejected.
Given the positive market reaction to Big Tech earnings earlier this week, it was reasonable to expect a similar reaction to the Amazon (AMZN) report after the markets closed yesterday. The company's revenue managed to beat expectations, having risen 26%, yet the Q1 profit fell to $2.5bn from $3.6bn in the prior year. The market deemed it underwhelming, and the stock soundly declined in aftermarket trading, dragging the index lower along.
Prices declined steeply in the overnight trading, extending yesterday's moderate downswing. That's how yesterday's session looks on the daily chart:
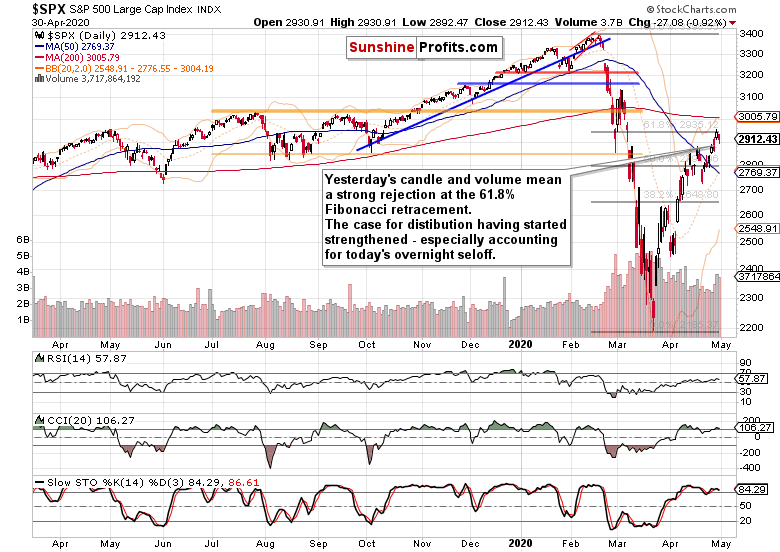
The daily candle and volume examination leans in favor of an early stage of a downswing. The chart itself though doesn't preclude a consolidation phase coupled with a renewed run to the 61.8% Fibonacci retracement. Given the sizable volume of last two sessions though, such a run would have little change of overcoming this resistance, which is also reinforced by the zone defining the early March bearish gap.
The fly in the ointment is the reaction to Amazon earnings. This steep a selloff makes it more than likely that the bear leg has already started in earnest, without a renewed attempt to reach the 61.8% Fibonacci retracement.
All right, as the S&P 500 futures trade now at around 2835, does that mean we won't get a better price point to exit our long position? Regardless of the deterioration we have seen in many S&P 500 sectors yesterday, we're likely to be offered an opportunity to reassess the outlook and our decision (coupled with a better price point than the current one).
As a result, we're of the opinion that exiting the open long position at this moment (4:10 AM EST) isn't justified.
Indeed, prices have moved to 2850 just before 5:00 AM EST. But the point is not about selling having momentarily waned. It's about both the credit markets and S&P 500 sectoral strength. Let's start with the debt markets.
The Credit Markets' Point of View
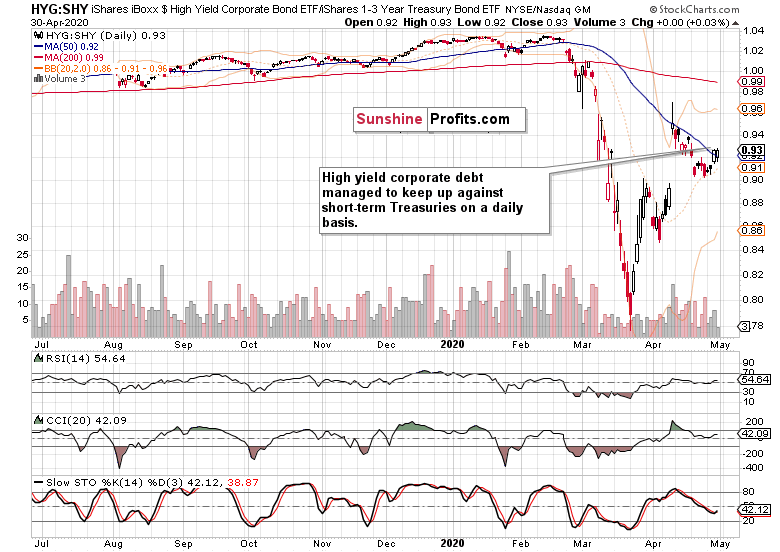
The high yield corporate debt to short-term Treasuries ratio (HYG:SHY) held up well on a daily basis. The volume examination of the HYG ETF itself (and also of municipals, the HYD ETF) is encouraging - the short-term debt markets aren't showing signs of deterioration.
However, this can't be said about investment grade corporate bonds to the longer-dated Treasuries ratio (LQD:IEI).
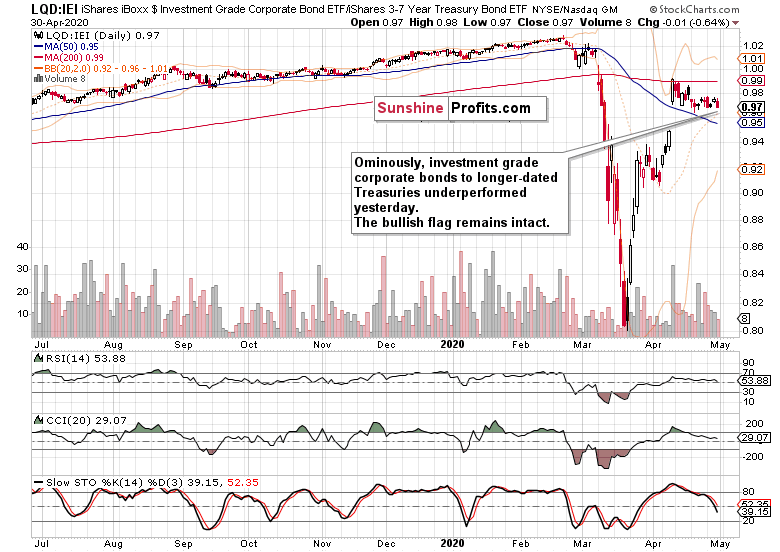
It's not a good short-term omen that the decline in the ratio was driven primarily by the declining high quality corporate debt. Unless this gets reversed and we see a breakout higher out of the bullish flag, this doesn't bode for the risk-on environment.
Key S&P 500 Sectors in Focus
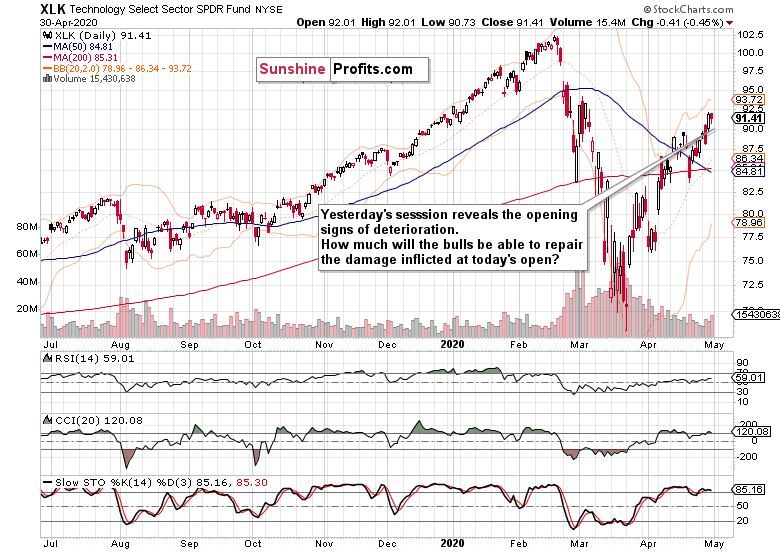
The daily candle in the tech sector doesn't lean in the direction of immediate gains. We've already mentioned the Amazon (AMZN) situation. Soon after the open, we'll see the extent of damage suffered throughout the sector, and assess the ability of the bulls to recover.
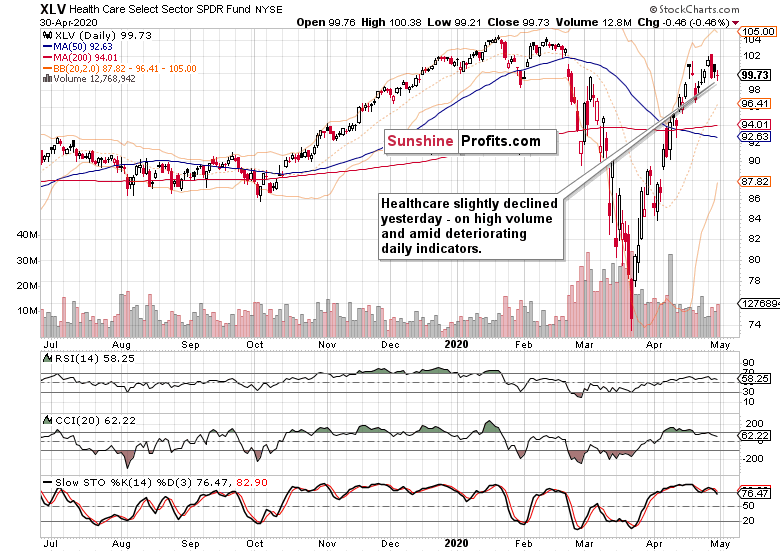
While healthcare didn't decline much, it's in a precarious technical situation. The deteriorating daily indicators point to short-term downside, and higher volume of yesterday's session points to increasing involvement of the sellers. Just as in tech, the buyers' ability to come back will guide our upcoming trading decision.
As the credit markets didn't give all too clear signals yesterday, which way did the financials move?
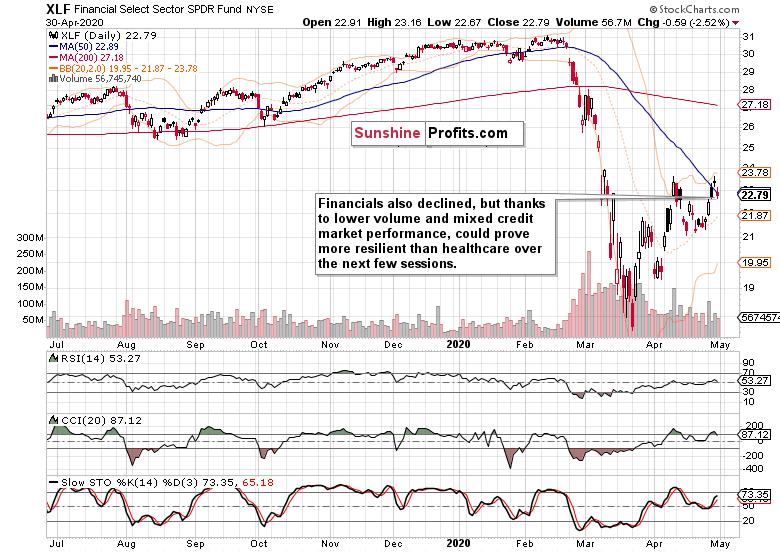
They moved down, but could prove more resilient than healthcare in the upcoming test of the bulls.
As for energy (XLE ETF), materials (XLB ETF) and industrials (XLI ETF), it's these sectors that have us on the edge. They all declined. While it can turn out to be the opening salvo in their own downside reversals, their individual charts point rather in the direction of only a short-term setback. This is because their prior upswings have made it above their preceding local highs, and also the volume increase on their yesterday's downswing didn't rise as much as it did in either in tech or healthcare.
From the Readers' Mailbag
Q: I'm very much a bear with where this market is right now, however I finally went long based on your analysis, and I caught the last big leg up. So thank you! However, today (today's premarket session) has been brutal...
A: Yes, the disconnect between the real economy incoming data and the stock market strength is palpable. However, we trade the stock market, and have to be keenly aware of what's going on there.
That's right, the Amazon disappointment is a setback, and we'll be monitoring the buyers as they go about repairing the damage. So far, it's nothing to call home about, but let's not jump to conclusions just yet, we mean right now.
Summary
Summing up, the 61.8% Fibonacci retracement challenge fizzled out yesterday, and given the Amazon aftermarket developments, the S&P 500 is bound to open lower later today. The credit markets' message is rather inconclusive in the very short-term, but the cracks in the sectoral performance are more apparent. We'll be monitoring the extent of the bulls' comeback - it'll form the basis for our upcoming trading decisions. At the moment, the open long position remains justified as we're likely to be offered a better exit point down the road should we decide to close the position, than is the case right now.
If you enjoyed the above analysis and would like to receive daily premium follow-ups, we encourage you to sign up for our Stock Trading Alerts to also benefit from the trading action we describe - the moment it happens. The full analysis includes more details about our current positions and levels to watch before deciding to open any new ones or where to close existing ones.
Thank you.
Monica Kingsley
Stock Trading Strategist
Sunshine Profits - Effective Investments through Diligence and Care
Free Gold &
Stock Market Newsletter
with details not available
to 99% investors
+ 7 days of Gold Alerts
Gold Alerts
More-
Status
New 2024 Lows in Miners, New Highs in The USD Index
January 17, 2024, 12:19 PM -
Status
Soaring USD is SO Unsurprising – And SO Full of Implications
January 16, 2024, 8:40 AM -
Status
Rare Opportunity in Rare Earth Minerals?
January 15, 2024, 2:06 PM

