

-
Stocks Are Set to Rally - Is This Still Just a Bounce?
December 7, 2021, 8:25 AMAvailable to premium subscribers only.
-
S&P 500 Still Above 4,500 – Have Stocks Bottomed?
December 6, 2021, 9:02 AMThe S&P 500 index broke slightly below the 4,500 mark on Friday, but it bounced from that support level again. Is this a bottoming pattern?
For in-depth technical analysis of various stocks and a recap of today's Stock Trading Alert we encourage you to watch today's video.
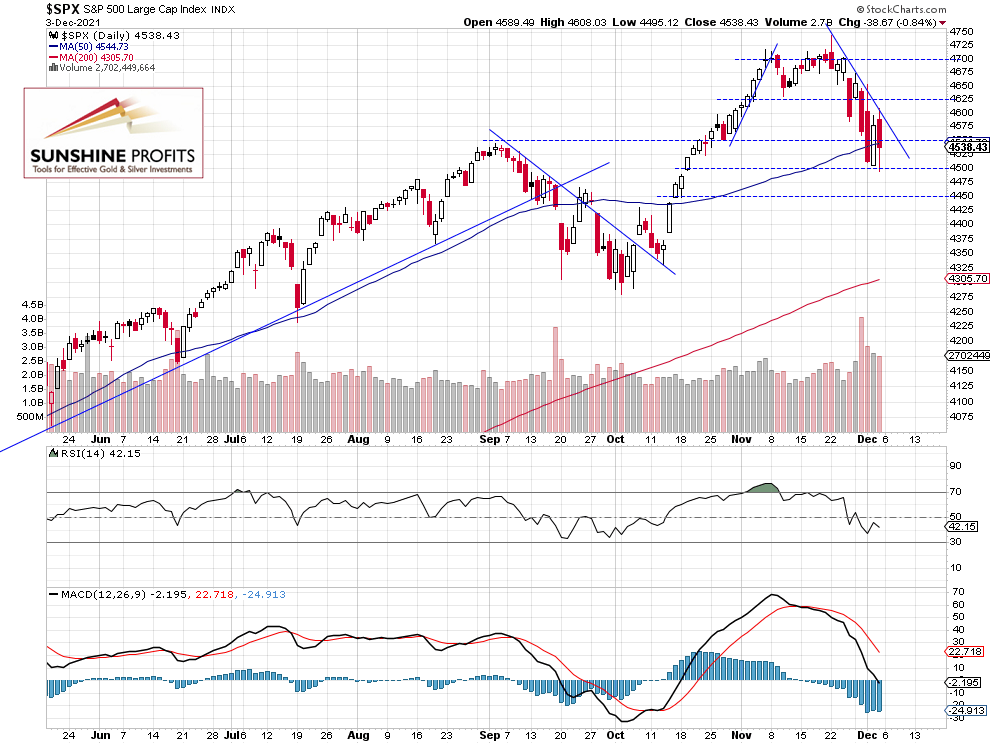
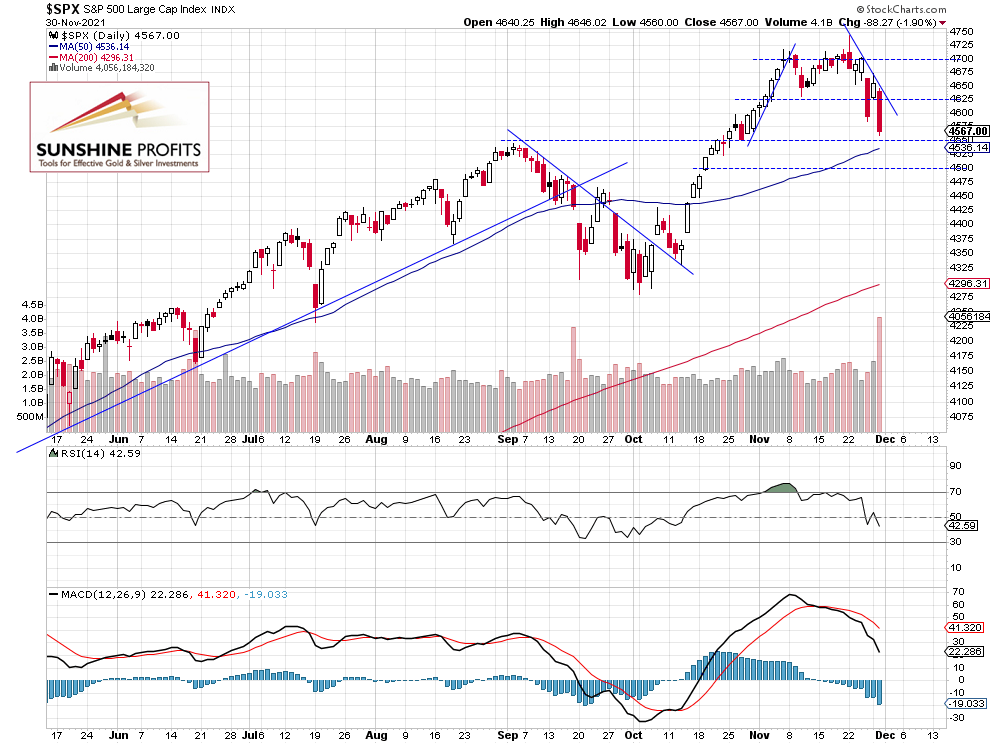
The broad stock market index lost 0.84% on Friday following Thursday’s advance of 1.4%. On Friday the index fell the lowest since the October 19 and it went below its early September local high of around 4,546 again. Overall, it lost 5.24% from the Nov. 22 record high of 4,743.83. Stocks fluctuate since last week’s Wednesday, so is this a bottoming pattern? For now, it looks like a flat correction or a consolidation within a downtrend. This morning the broad stock market is expected to open 0.4% higher and we may see some more short-term consolidation following the recent declines.
The nearest important support level is still at 4,500. On the other hand, the resistance level is at 4,580-4,600, marked by the recent local lows. The S&P 500 remains below its short-term downward trend line, as we can see on the daily chart (chart by courtesy of http://stockcharts.com):

Nasdaq 100 Broke Below the 16,000 Level
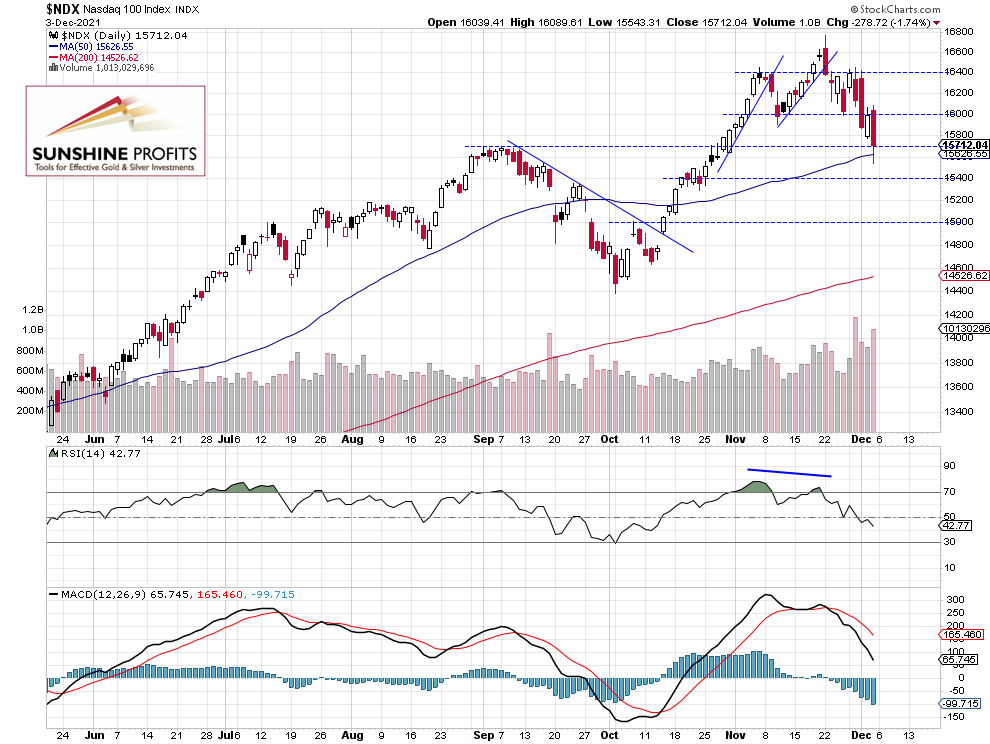
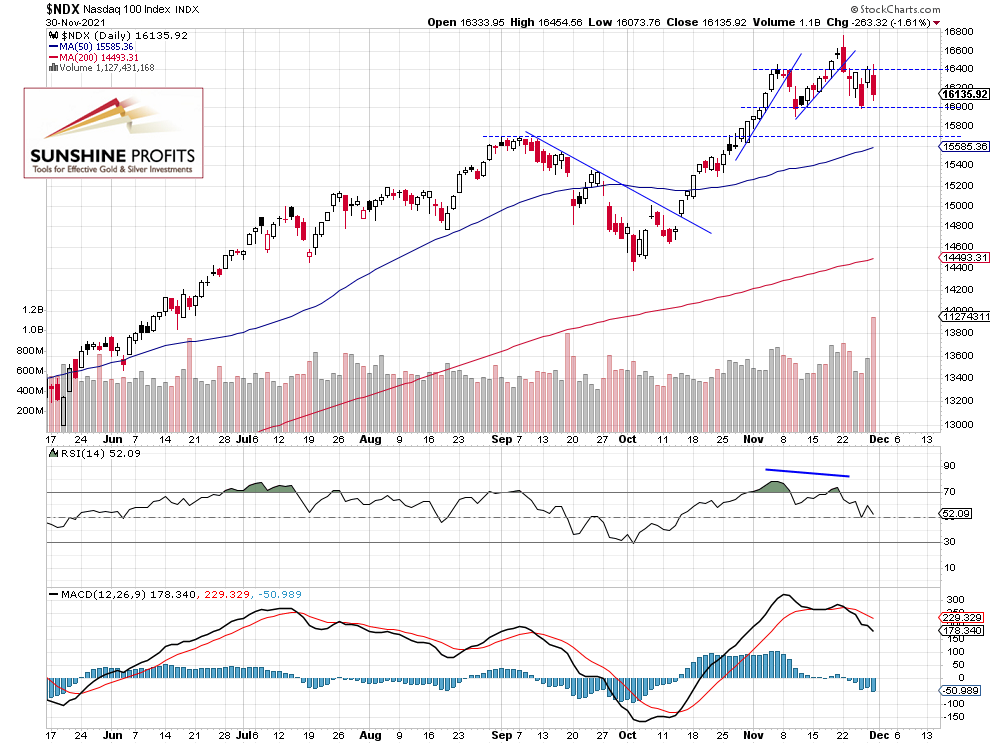
Let’s take a look at the Nasdaq 100 chart. The technology index remained relatively stronger than the broad stock market recently but on Friday it broke below the support level of 16,000 and it was relatively weaker than the S&P 500 index that day. The tech stocks’ gauge fell below the early September local highs, as we can see on the daily chart:

Conclusion
The S&P 500 index slightly extended its downtrend on Friday and it was 5.24% below the November 22 record high. So it is still just a downward correction and not a new bear market. But we may see some more downside. For now, it looks like a consolidation within a downtrend, as there have been no confirmed positive signals so far.
Here’s the breakdown:
- The S&P 500 slightly extended its short-term downtrend on Friday.
- A speculative short position is still justified from the risk/reward perspective.
- We are expecting an over 5% correction.
Today's premium Stock Trading Alert includes details of our trading position. Interested in more exclusive updates? Join our premium Stock Trading Alerts newsletter and read all the details today.
Thank you.
Paul Rejczak,
Stock Trading Strategist
Sunshine Profits: Effective Investments through Diligence and Care -
S&P 500 – Is a 5% Correction Enough?
December 3, 2021, 9:21 AMThe S&P 500 bounced from the 4,500 level on Thursday, as it retraced most of its Wednesday’s sell-off. Was it a reversal or just another upward correction?
For in-depth technical analysis of various stocks and a recap of today's Stock Trading Alert we encourage you to watch today's video.
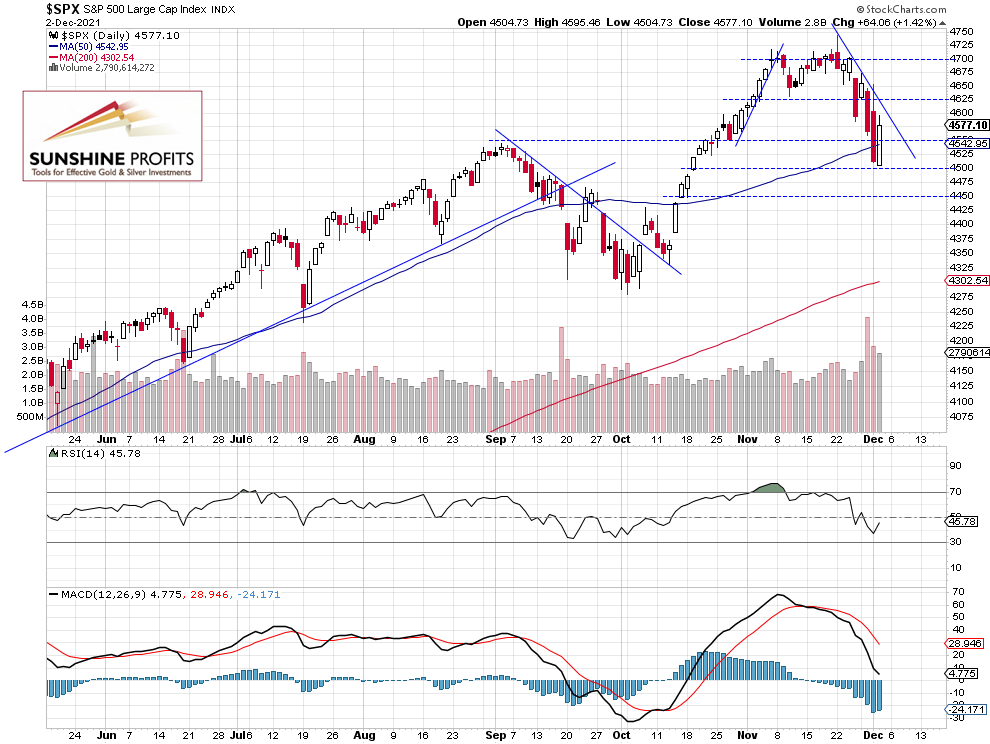
The broad stock market index gained 1.42% on Thursday after opening slightly lower and bouncing from the new local low of 4,504.73. The index fell the lowest since the October 19 and it went below its early September local high of around 4,546. Overall, it lost 5.04% from the Nov. 22 record high of 4,743.83. But Thursday’s trading session was bullish and stocks were gaining. Was it an upward reversal? This morning stocks are expected to open 0.3% higher after the mixed monthly jobs data release. For now, it looks like a correction within a downtrend. We may see a short-term consolidation following the recent declines.
The nearest important support level is now at 4,500. On the other hand, the resistance level is at 4,580-4,600, marked by the recent local lows. The S&P 500 remains below its short-term downward trend line, as we can see on the daily chart (chart by courtesy of http://stockcharts.com):

Nasdaq 100 Remains Close to the 16,000 Level
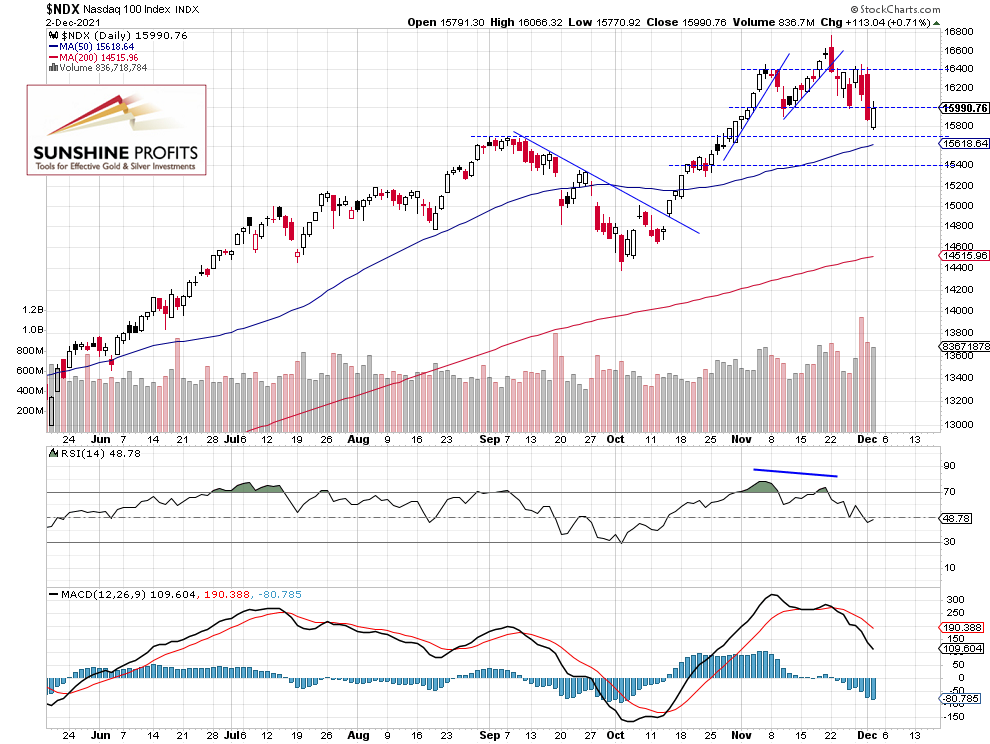
Let’s take a look at the Nasdaq 100 chart. The technology index remains relatively stronger than the broad stock market, as it is still trading above the early September local highs of around 15,700. However, the technology index gained just 0.7% yesterday, as we can see on the daily chart:

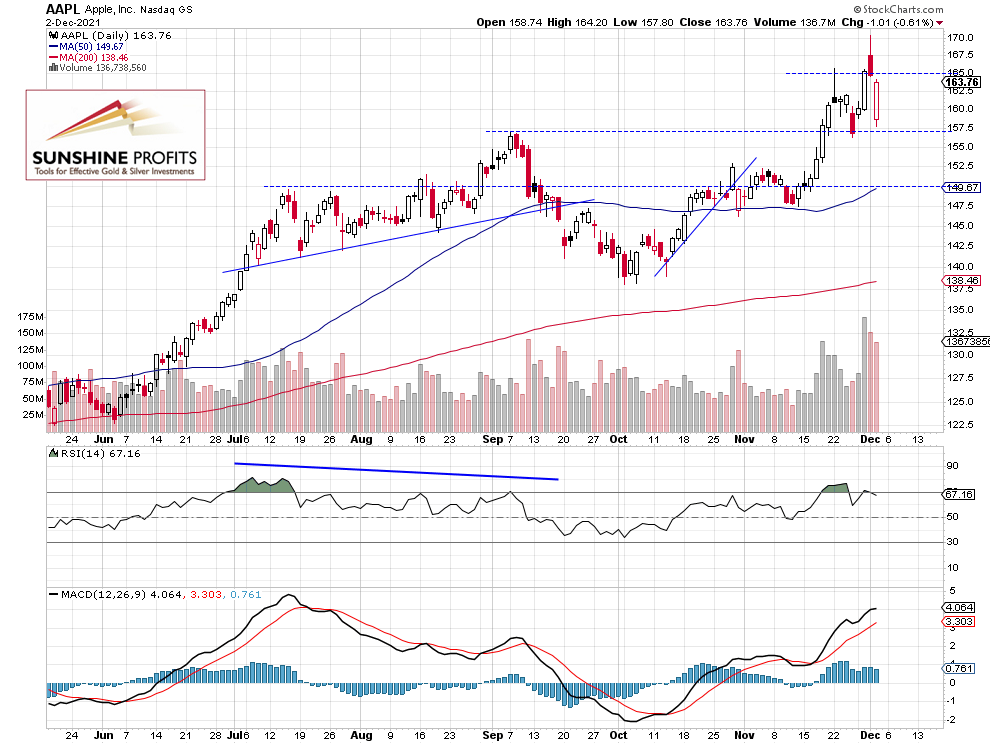
Apple Remains Volatile After Reaching New Record High
Let’s take a look at biggest stock in the S&P 500 index: AAPL. Apple accelerated its uptrend once again and on Wednesday it reached the new record high of $170.30. Apple’s market cap reached almost 2.8 trillion dollars! But on Thursday, the stock was 7.3% below its Wednesday’s high, before bouncing back above the $160 level. So the stock price remains very volatile and we may see a medium-term topping pattern.

Conclusion
The S&P 500 index is expected to open 0.3% higher this morning after the mixed monthly jobs data release. We may see a consolidation and some more volatility following the recent declines. There have been no confirmed positive signals so far.
Here’s the breakdown:
- The S&P 500 slightly extended its short-term downtrend yesterday before bouncing from the 4,500 level.
- A speculative short position is still justified from the risk/reward perspective.
- We are expecting an over 5% correction.
Today's premium Stock Trading Alert includes details of our trading position. Interested in more exclusive updates? Join our premium Stock Trading Alerts newsletter and read all the details today.
Thank you.
Paul Rejczak,
Stock Trading Strategist
Sunshine Profits: Effective Investments through Diligence and Care -
S&P 500 Almost 5% Below the ATH – Will Correction Continue?
December 2, 2021, 8:49 AMAvailable to premium subscribers only.
-
Stocks - More Volatility Following Hawkish Powell
December 1, 2021, 8:42 AMStock prices were volatile on Tuesday, as the S&P 500 fell to the new local low. But today it may rebound again. but will the downtrend continue?
For in-depth technical analysis of various stocks and a recap of today's Stock Trading Alert we encourage you to watch today's video.
The S&P 500 index lost 1.90% on Tuesday, Nov. 30. The market went lower following testimonies from the Fed Chair Powell and the Treasury Secretary Yellen. On Monday the broad stock market retraced more than a half of its Friday’s sell-off, but yesterday it fell to the new local low of 4,560.00. Today it is expected to open 1.0% higher again, so we will see more short-term volatility.
The nearest important support level is at 4,560-4,600. On the other hand, the resistance level is at 4,650, marked by the recent local lows. The S&P 500 retraced most of its early November advance, as we can see on the daily chart (chart by courtesy of http://stockcharts.com):

Nasdaq 100 Remains Relatively Stronger
Let’s take a look at the Nasdaq 100 chart. The technology index remained relatively stronger than the broad stock market yesterday, as it didn’t extend a short-term downtrend. It remained above its Friday’s local low and above the 16,000 mark, as we can see on the daily chart:

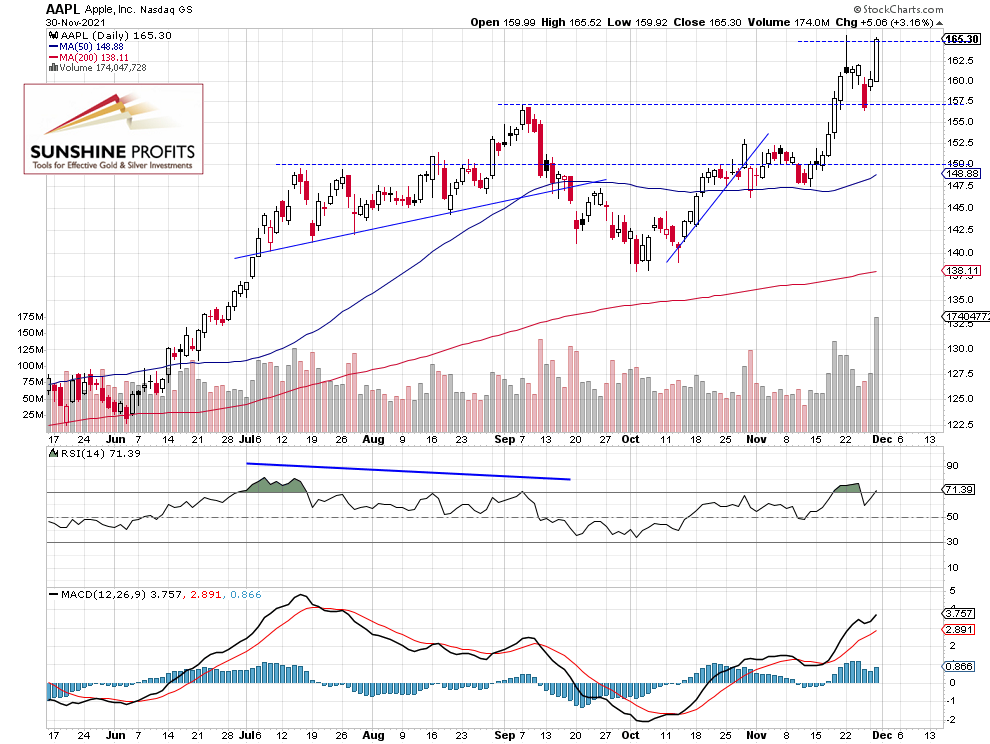
Apple Got Close to the Record High Again
Let’s take a look at biggest stock in the S&P 500 index: AAPL. Apple accelerated its uptrend a week ago and it reached the new record high of $165.70. However, it retraced almost all of its intraday advance that day. On Friday it got back to a support level of around $157. And yesterday it got back to the all-time high, as it closed slightly above the $165 price level.

Conclusion
The S&P 500 index is expected to open 1.0% higher this morning following an overnight rebound from the yesterday’s new short-term low. We will likely see an intraday consolidation following a higher opening. And for now, it looks like a consolidation within a short-term downtrend.
Here’s the breakdown:
- The S&P 500 extended its short-term downtrend yesterday, but today it is expected to open higher again.
- A speculative short position is still justified from the risk/reward perspective.
- We are expecting a 5% correction.
Today's premium Stock Trading Alert includes details of our trading position. Interested in more exclusive updates? Join our premium Stock Trading Alerts newsletter and read all the details today.
Thank you.
Paul Rejczak,
Stock Trading Strategist
Sunshine Profits: Effective Investments through Diligence and Care
Free Gold &
Stock Market Newsletter
with details not available
to 99% investors
+ 7 days of Gold Alerts
Gold Alerts
More-
Status
New 2024 Lows in Miners, New Highs in The USD Index
January 17, 2024, 12:19 PM -
Status
Soaring USD is SO Unsurprising – And SO Full of Implications
January 16, 2024, 8:40 AM -
Status
Rare Opportunity in Rare Earth Minerals?
January 15, 2024, 2:06 PM

