

-
Stocks to Open Higher but Another Profit-taking Action is Likely
November 15, 2021, 9:25 AMStocks retraced some of their recent declines on Friday and the S&P 500 index is expected to open higher this morning. So is the downward correction over?
The S&P 500 index gained 0.72% on Friday, Nov. 12, as investor sentiment turned bullish and the market bounced from the support level of around 4,650. On Wednesday it fell to the local low of 4,630.86 and it was almost 88 points or 1.86% below the previous week’s Friday’s record high of 4,718.50.
The recent rally was not broad-based and it was driven by a handful of tech stocks like MSFT, NVDA, TSLA. The market seemed overbought in the short-term and traded within a topping pattern. But today the index may get back to the 4,700 level.
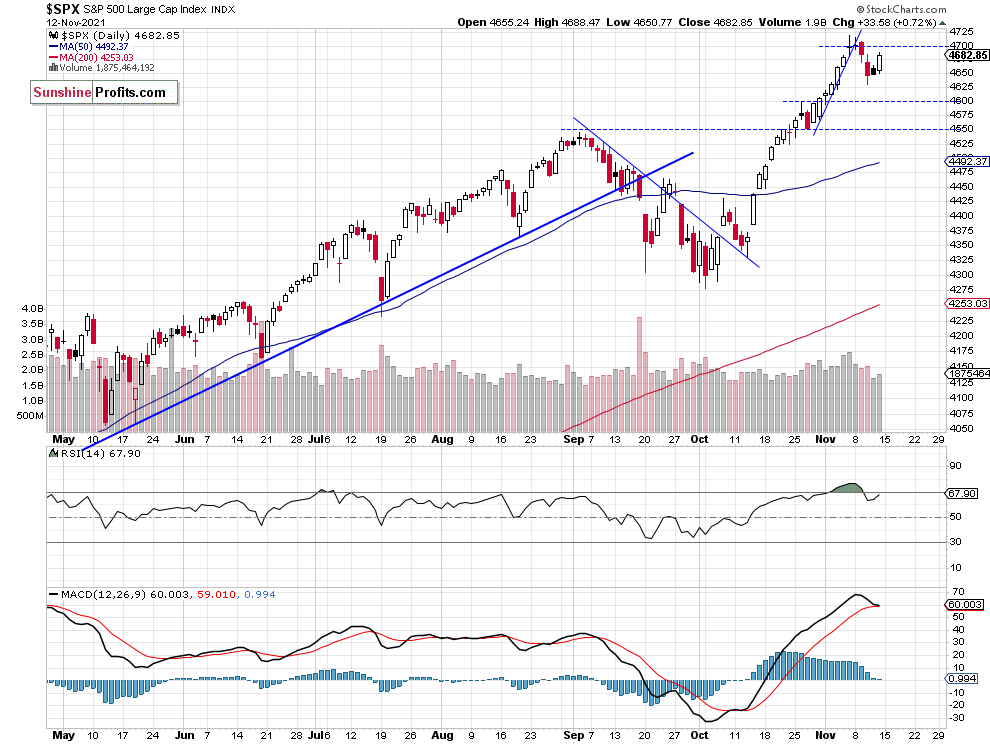
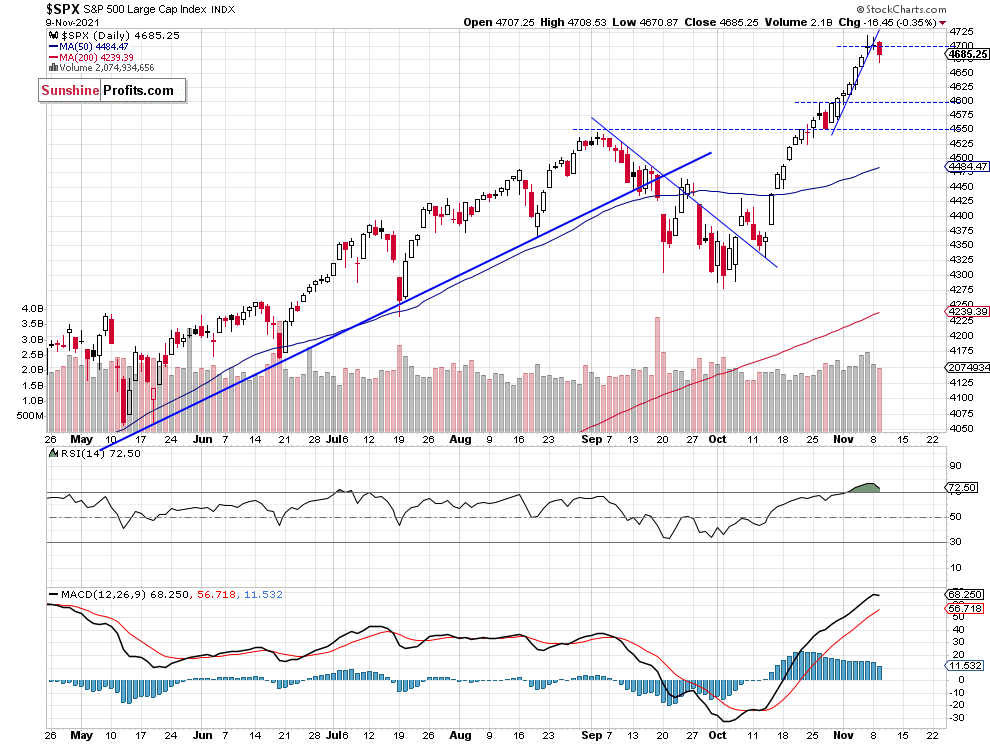
The nearest important support level remains at 4,630-4,650 and the next support level is at 4,600. On the other hand, the resistance level is at 4,700-4,720. The S&P 500 broke below its steep short-term upward trend line recently, as we can see on the daily chart (chart by courtesy of http://stockcharts.com):

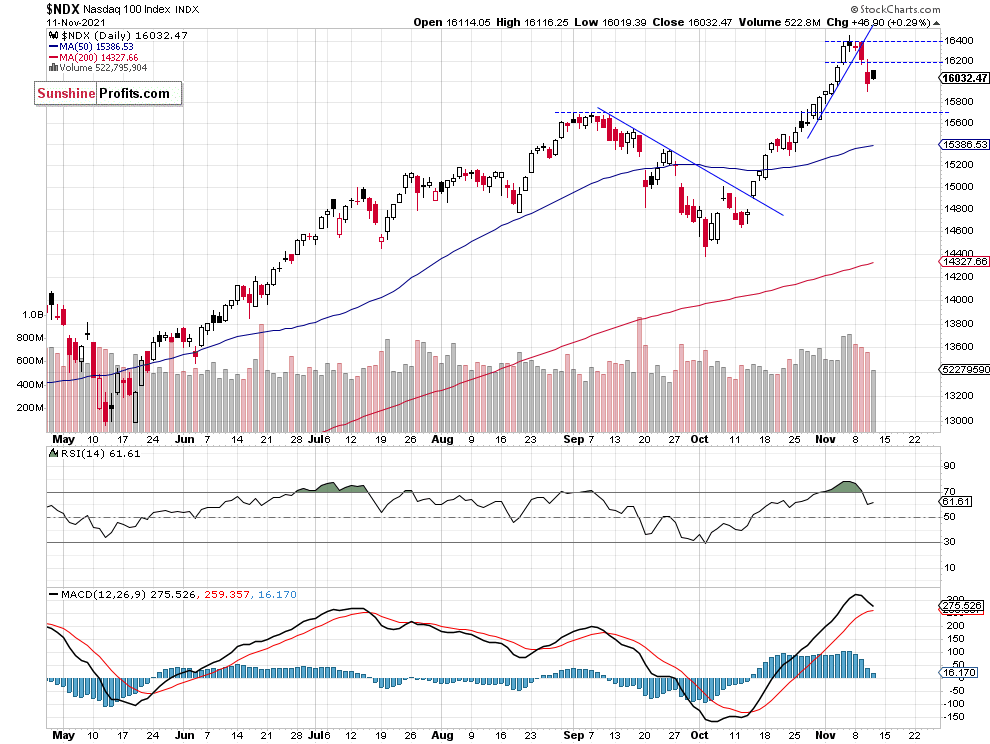
Nasdaq Bounced From the 16,000 Level
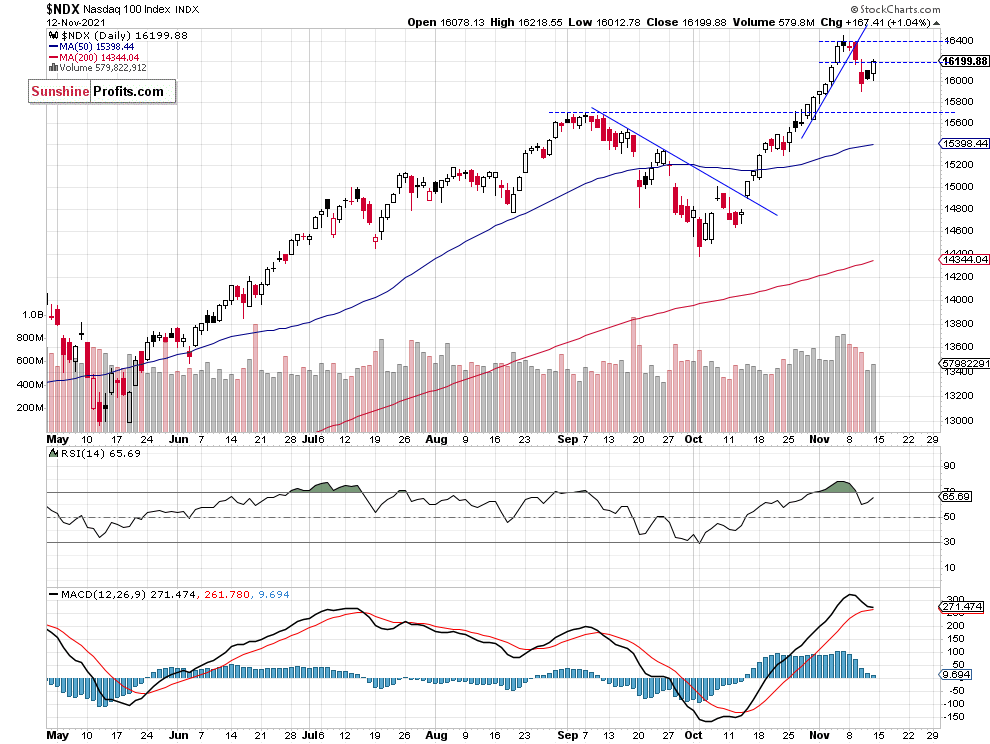
Let’s take a look at the Nasdaq 100 chart. In the previous week the technology index broke above the 16,000 level and it was trading at the new record high. The market accelerated higher above its short-term upward trend line. But since then it has been retracing the rally. On Friday the index retraced some of the recent declines, however it remained below its short-term local lows, as we can see on the daily chart:

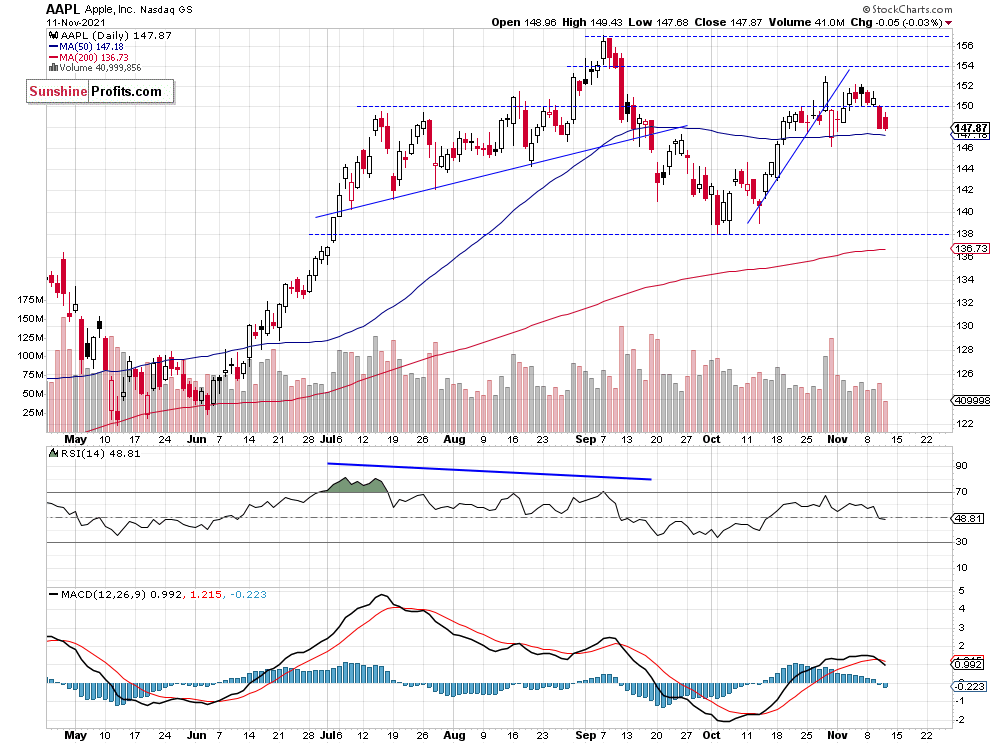
Apple Is Still Close to $150, Microsoft Remains Relatively Strong
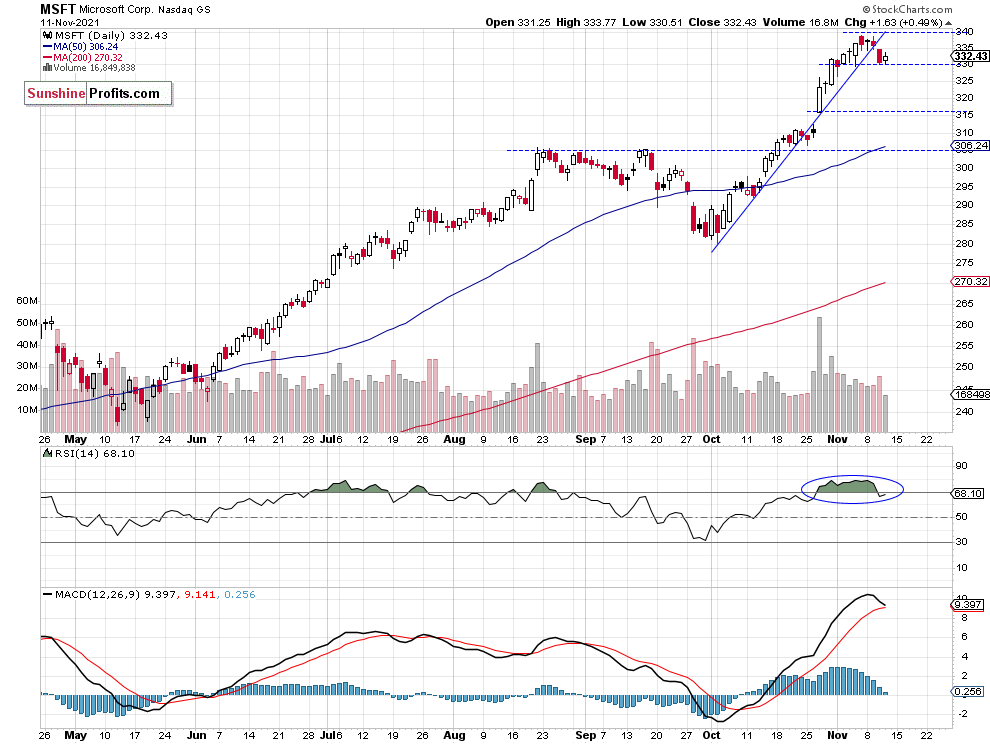
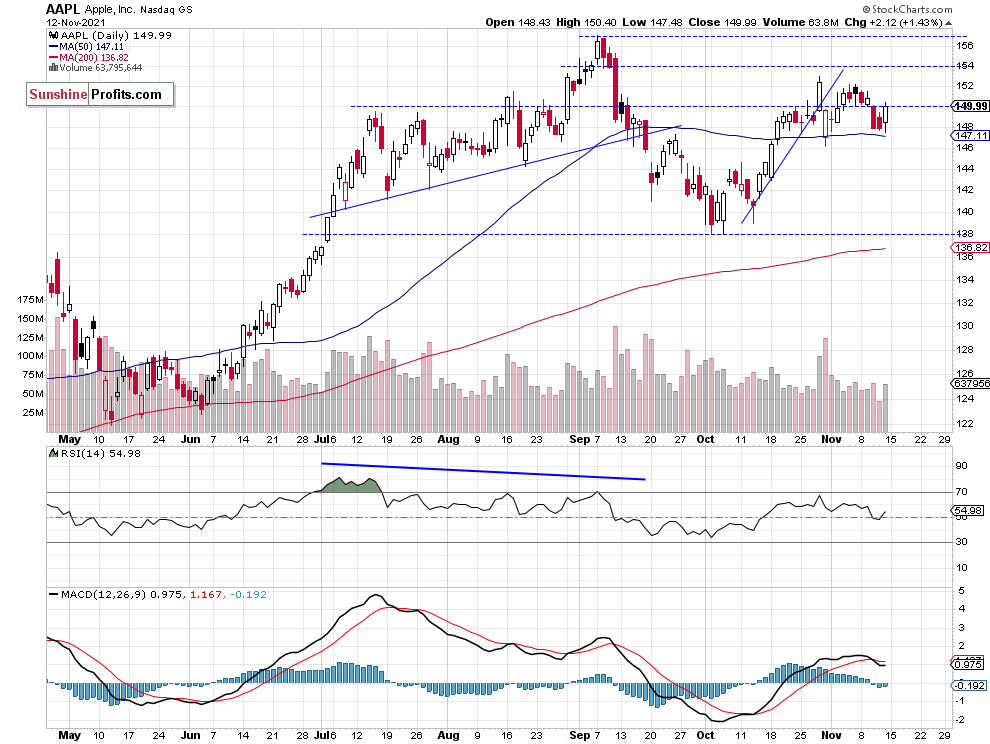
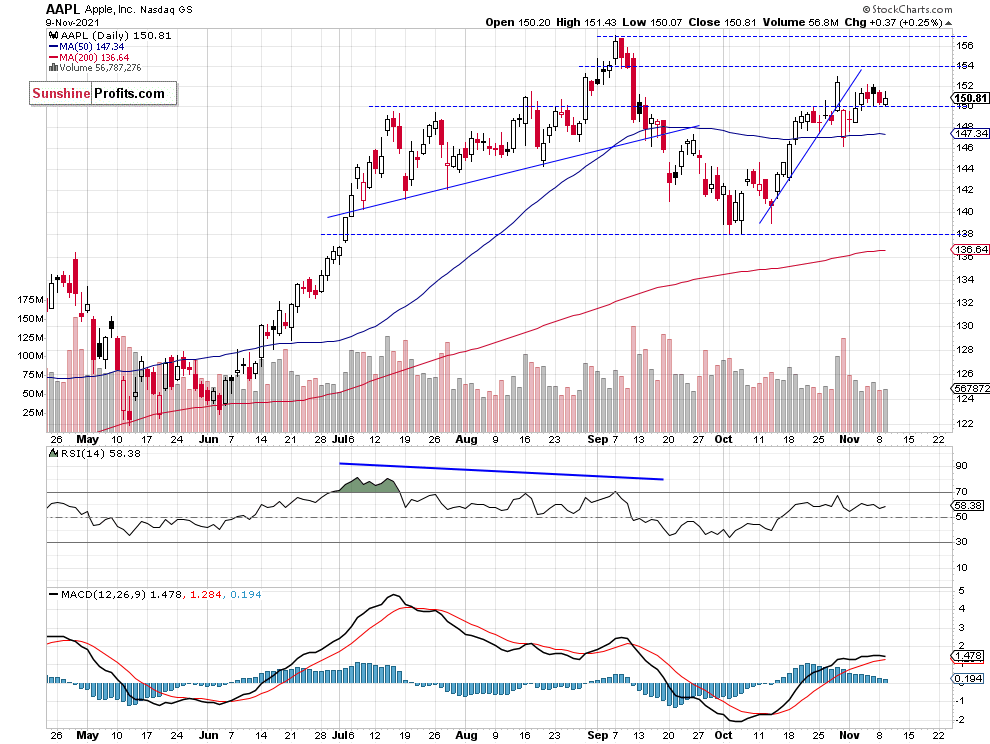
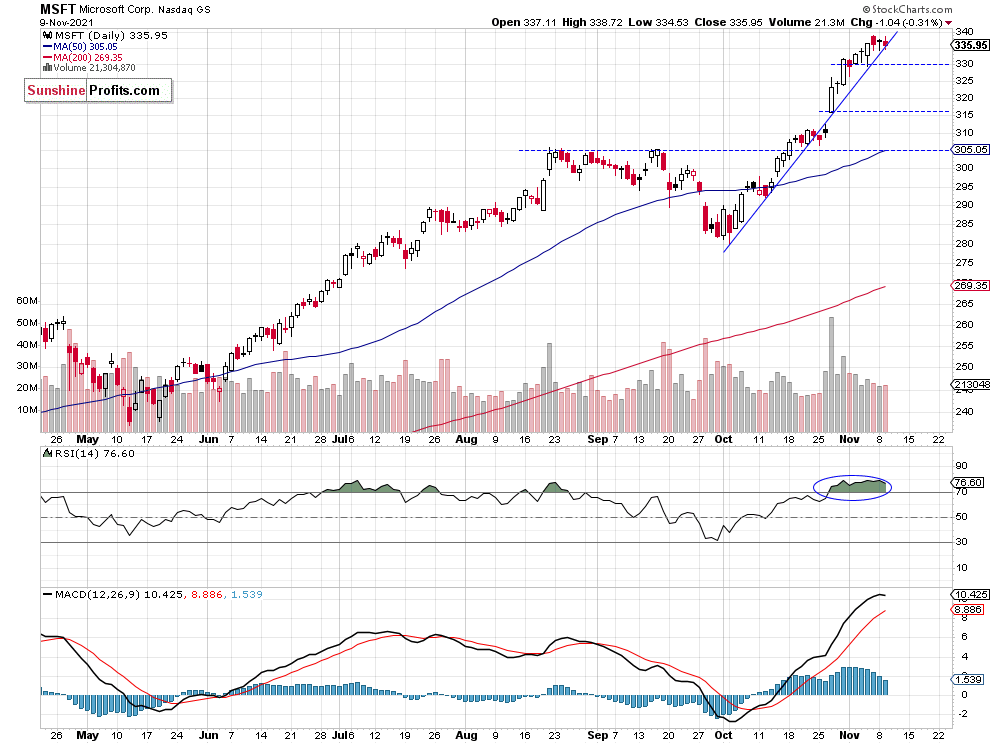
Let’s take a look at the two biggest stocks in the S&P 500 index, AAPL and MSFT. Apple continues to fluctuate along the $150 price level. It is still well below the early September record high. Microsoft stock was reaching new record highs recently but last week it broke below its upward trend line. So those two big cap tech stocks remain mixed, as we can see on their daily charts:

 Conclusion
The S&P 500 index retraced some of its recent declines on Friday and today it is expected to open 0.4% higher. So it looks like a downward correction is over and the market may reach new highs or at least extend a short-term consolidation along the 4,700 level. Investors will wait for tomorrow’s Retail Sales number release and some Fed-talk later in the week.
Here’s the breakdown:
- The S&P 500 is expected to extend its Friday’s advance this morning and it may get to the 4,700 level.
- Still no positions are justified from the risk/reward point of view.
Today's premium Stock Trading Alert includes details of our trading position. Interested in more exclusive updates? Join our premium Stock Trading Alerts newsletter and read all the details today.
Thank you.
Paul Rejczak,
Stock Trading Strategist
Sunshine Profits: Effective Investments through Diligence and Care -
S&P 500: More Short-Term Uncertainty As Trading Range Narrows
November 12, 2021, 10:22 AMThe S&P 500 index went sideways on Thursday following a decline from its last week’s high. Is the downward correction over?
For in-depth technical analysis of various stocks and a recap of today's Stock Trading Alert we encourage you to watch today's video.
The S&P 500 index gained 0.06% on Thursday, as it fluctuated along the 4,650 level. On Wednesday it fell to the local low of 4,630.86 and it was almost 88 points or 1.86% below the last week’s Friday’s record high of 4,718.50.
The recent rally was not broad-based and it was driven by a handful of tech stocks like MSFT, NVDA, TSLA. The market seemed overbought in the short-term and traded within a topping pattern. Today the index may extend a short-term consolidation.
The nearest important support level remains at 4,630-4,650 and the next support level is at 4,600. On the other hand, the resistance level is at 4,700-4,720. The S&P 500 broke below its steep short-term upward trend line, as we can see on the daily chart (chart by courtesy of http://stockcharts.com):

Nasdaq’s Downward Correction
Let’s take a look at the Nasdaq 100 chart. The technology index broke above the 16,000 level last week and on Friday it was trading at the new record high. The market accelerated higher above its short-term upward trend line. But since then it has been retracing the rally. The resistance level remains at 16,400, and the short-term support level is at 16,000, among others, as we can see on the daily chart:

Apple Remains Relatively Weak, Microsoft Breaks Below the Trend Line
Let’s take a look at the two biggest stocks in the S&P 500 index, AAPL and MSFT. Apple came back below the $150 price level. It is still well below the early September record high. Microsoft stock was reaching new record highs recently but on Wednesday it broke below its upward trend line. So the megacaps tech stocks turned lower, as we can see on their daily charts:

 Conclusion
The S&P 500 index was little changed on Thursday and today it is expected to retrace some of its recent declines. So is the downward correction over? For now, there has been no confirmed short-term upward reversal and we may see some more consolidation below the 4,700 mark. The market may go sideways today, as investors keep taking short-term profits off the table following the recent economic and quarterly corporate earnings releases.
Here’s the breakdown:
- The S&P 500 retraced some of its record-breaking rally in the last few trading sessions – for now it looks like a downward correction.
- Still no positions are justified from the risk/reward point of view.
Today's premium Stock Trading Alert includes details of our trading position. Interested in more exclusive updates? Join our premium Stock Trading Alerts newsletter and read all the details today.
Thank you.
Paul Rejczak,
Stock Trading Strategist
Sunshine Profits: Effective Investments through Diligence and Care -
Stocks Market Found a Local Bottom, but It’s Not a Dip Buying Opportunity
November 11, 2021, 10:16 AMAvailable to premium subscribers only.
-
S&P 500: Inflation Fears May Push Stock Prices Lower
November 10, 2021, 9:28 AMStocks’ short-term rally came to an end this week and the S&P 500 index entered a consolidation along the 4,700 level. Is this a topping pattern?
The S&P 500 index lost 0.35% yesterday, as it fell below the 4,700 price mark following two-day-long consolidation along the Friday’s record high of 4,718.50. The recent rally was not broad-based and it was driven by a handful of tech stocks like MSFT, NVDA, TSLA. The market seems overbought in the short-term and most likely it’s trading within a topping pattern. Today we may see another consolidation or a profit taking action following worse than expected inflation data release (the CPI monthly number came at +0.9% vs. the expected +0.6%).
The nearest important support level is at 4,650-4,675 and the next support level is at 4,600. On the other hand, the resistance level is at 4,700-4,720. The S&P 500 broke below its steep short-term upward trend line, as we can see on the daily chart (chart by courtesy of http://stockcharts.com):

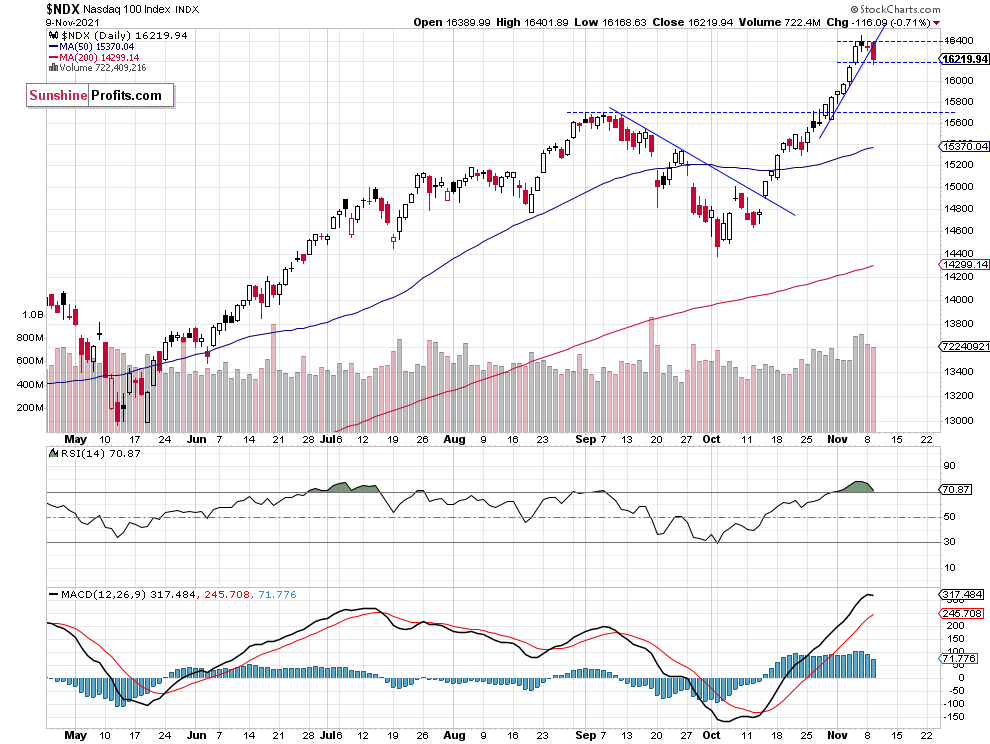
Nasdaq Lost 0.7% on Tuesday
Let’s take a look at the Nasdaq 100 chart. The technology index broke above the 16,000 level recently and it was trading at the new record high. The market accelerated parabolically above its short-term upward trend line. But yesterday it lost 0.7% and closed below that trend line. The resistance level remains at 16,400, and the short-term support level is at 16,000, among others, as we can see on the daily chart:

Apple’s Further Consolidation and Microsoft’s Potential Topping Pattern
Let’s take a look at the two biggest stocks in the S&P 500 index, AAPL and MSFT. Apple continues to trade within a consolidation along the $150 level and it is still well below the record highs, and the Microsoft is close to breaking below its over month-long upward trend line. So the tech “megacaps” may be turning lower, as we can see on their daily charts:


Conclusion
The broad stock market went slightly lower on Tuesday and we may see a downward continuation this morning. The main indices are expected to open 0.2-0.5% lower following worse (higher) than expected consumer inflation number release.
It looks like a topping pattern and we may see a downward correction at some point. There may be a profit-taking action following quarterly earnings releases.
Here’s the breakdown:
- The S&P 500 extended its uptrend last week, but since Friday it is trading within a short-term downtrend.
- But still no positions are justified from the risk/reward point of view.
Today's premium Stock Trading Alert includes details of our trading position. Interested in more exclusive updates? Join our premium Stock Trading Alerts newsletter and read all the details today.
Thank you.
Paul Rejczak,
Stock Trading Strategist
Sunshine Profits: Effective Investments through Diligence and Care -
Stocks’ Consolidation – Is This a Topping Pattern or Just a Pause Before Another Leg Up?
November 9, 2021, 9:14 AMAvailable to premium subscribers only.


Free Gold &
Stock Market Newsletter
with details not available
to 99% investors
+ 7 days of Gold Alerts
Gold Alerts
More-
Status
New 2024 Lows in Miners, New Highs in The USD Index
January 17, 2024, 12:19 PM -
Status
Soaring USD is SO Unsurprising – And SO Full of Implications
January 16, 2024, 8:40 AM -
Status
Rare Opportunity in Rare Earth Minerals?
January 15, 2024, 2:06 PM

