

-
S&P 500: Rallying Tech Stocks vs. Plummeting Oil Stocks
November 22, 2021, 9:26 AMThe S&P 500 index nearly topped its record high on Friday, but it closed lower following an intraday decline. Is this a topping pattern?
For in-depth technical analysis of various stocks and a recap of today's Stock Trading Alert we encourage you to watch today's video.
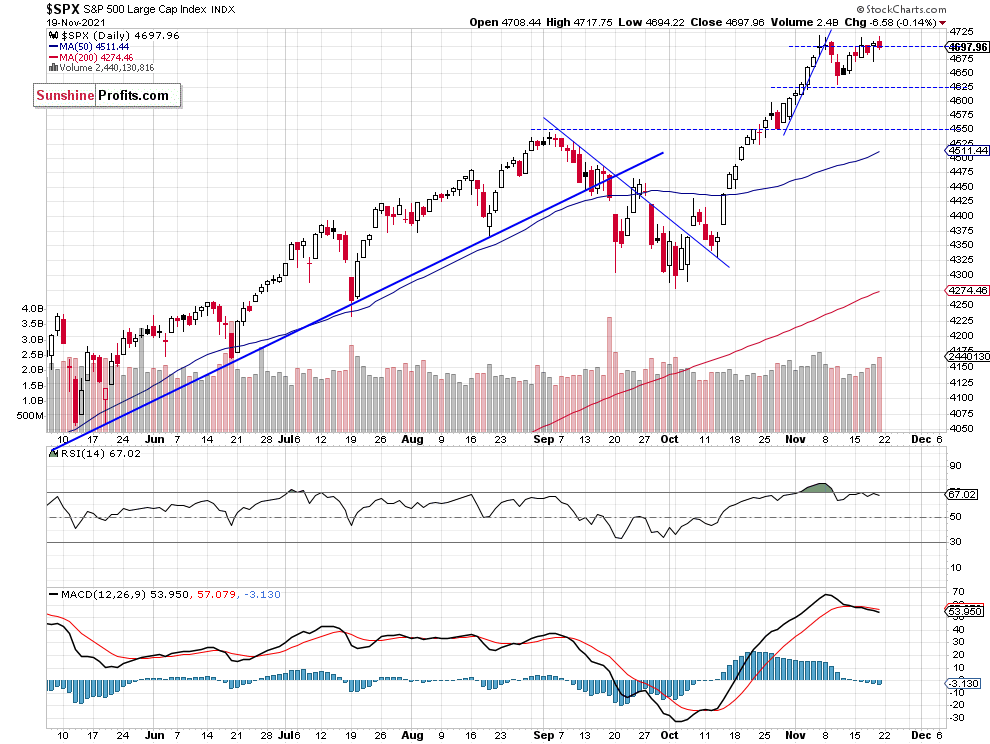
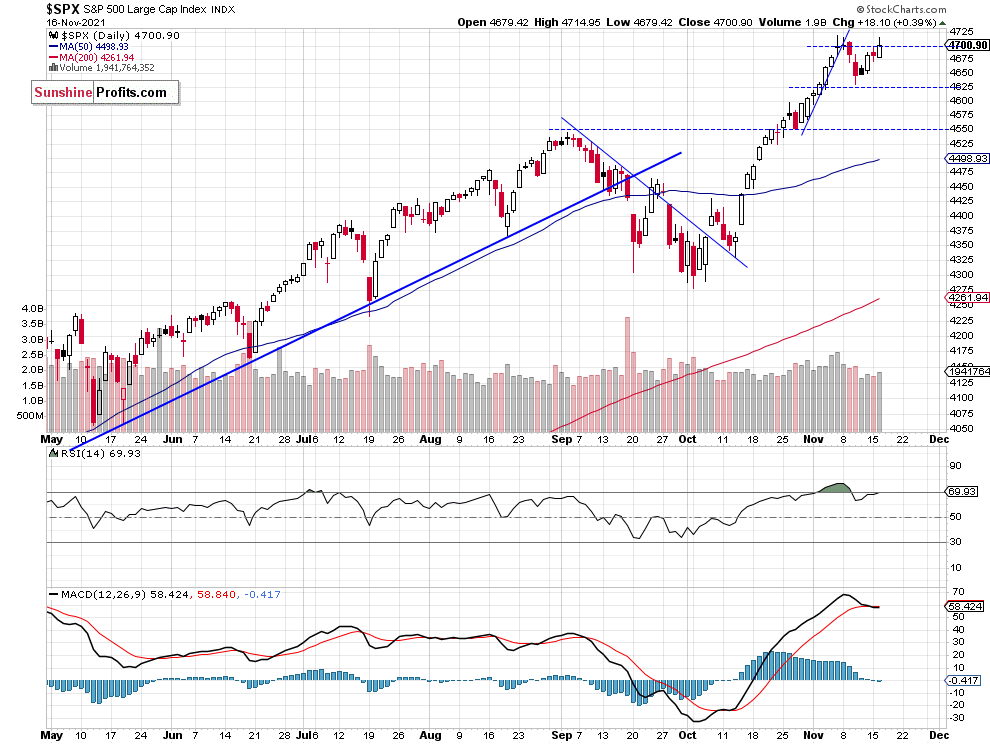
.The S&P 500 index lost 0.14% on Friday, Nov. 19, as it extended its short-term consolidation along the 4,700 level. The broad stock market went sideways despite record-breaking rallies in large tech stocks like AAPL, MSFT and NVDA. It still looks like a short-term topping pattern, as the S&P 500 index keeps bouncing from the Nov. 5 record high of 4,718.50.
The nearest important support level remains at 4,630-4,650 and the next support level is at 4,600. On the other hand, the resistance level is at 4,700-4,720. The S&P 500 continues to trade along the 4,700 level, as we can see on the daily chart (chart by courtesy of http://stockcharts.com):
Nasdaq Reached the New Record High
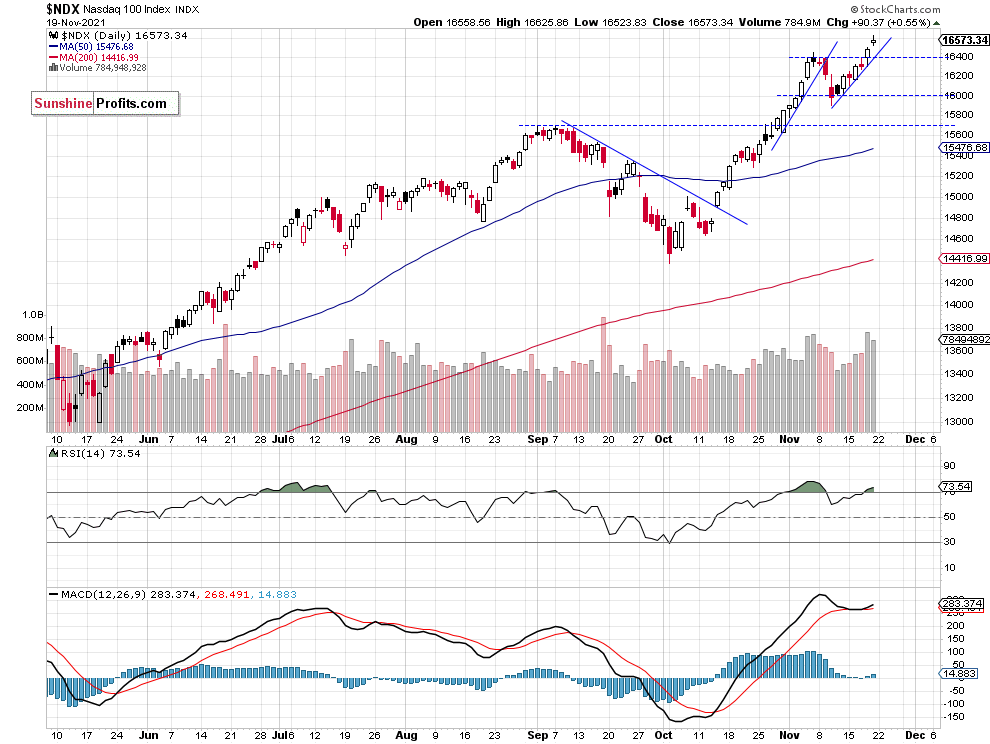
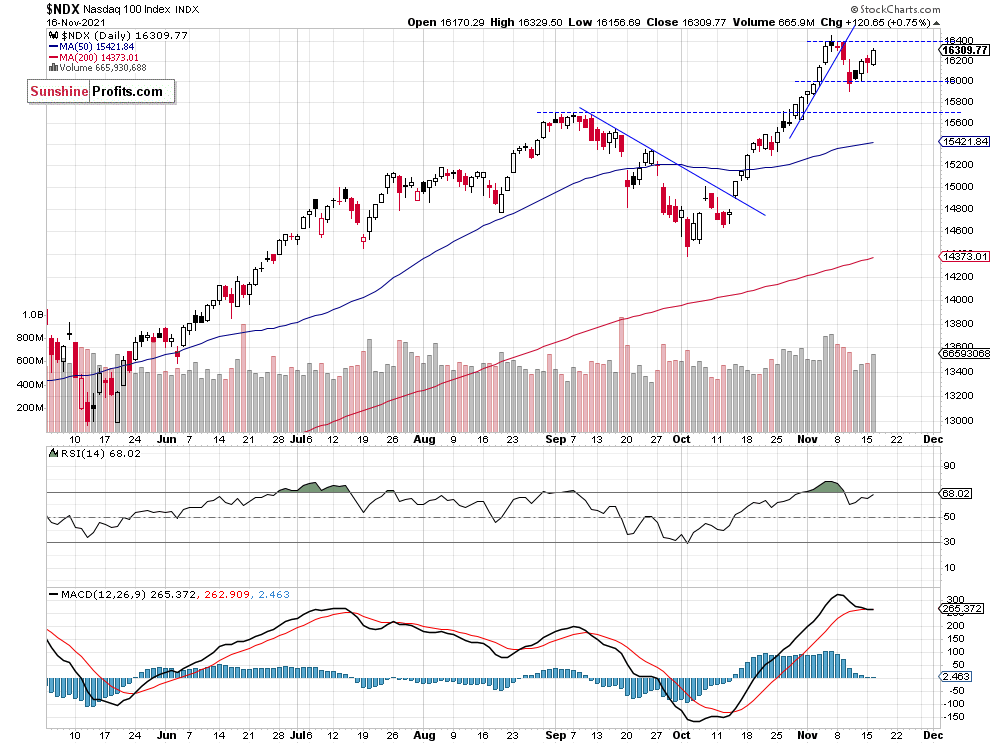
Let’s take a look at the Nasdaq 100 chart. The technology index reached the new record high of 16,625.86 on Friday, led by megacap tech stock rallies. It accelerated above its short-term upward trend line after breaking above the resistance level of 16,400 on Thursday. There have been no confirmed negative signals so far. However, we can see some short-term overbought conditions.
Apple and Microsoft at New Record Highs
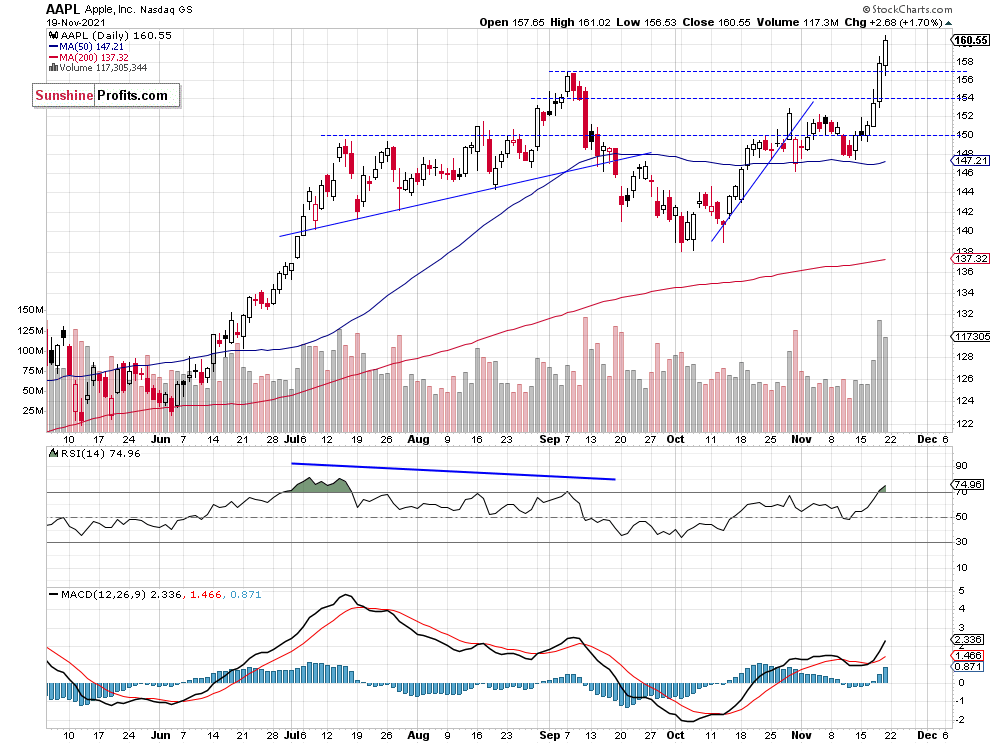
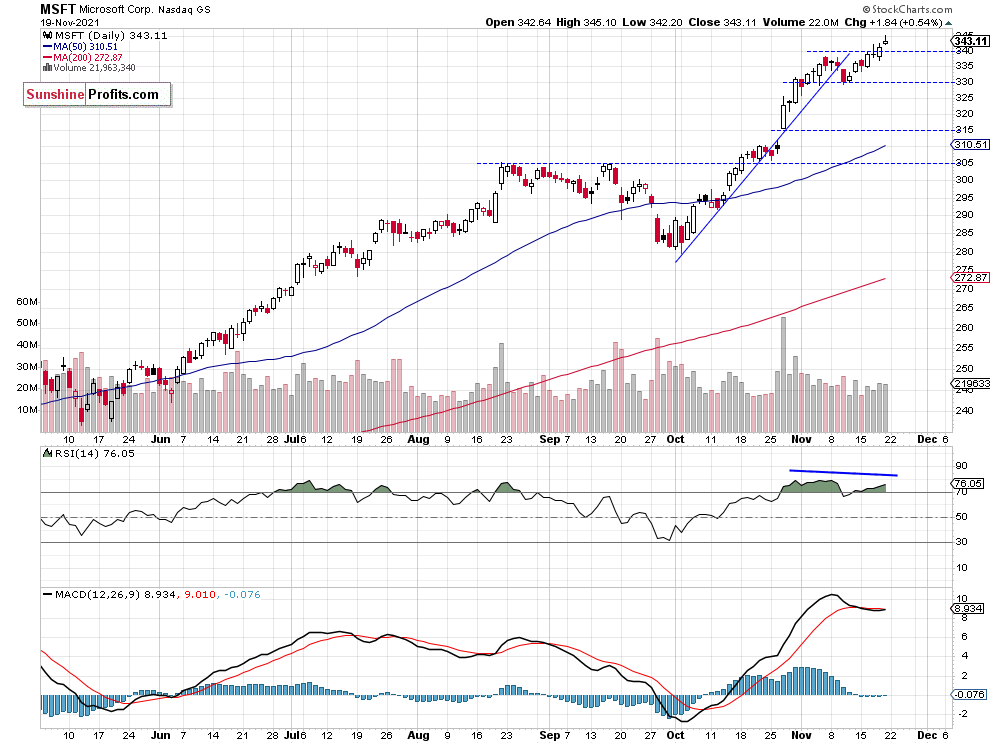
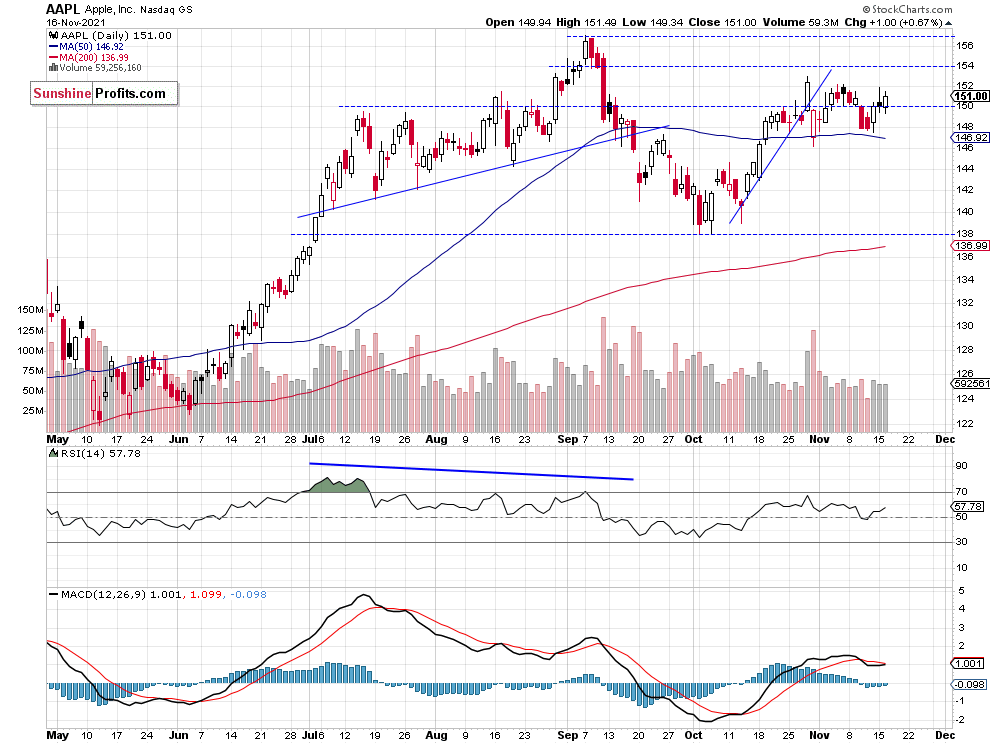
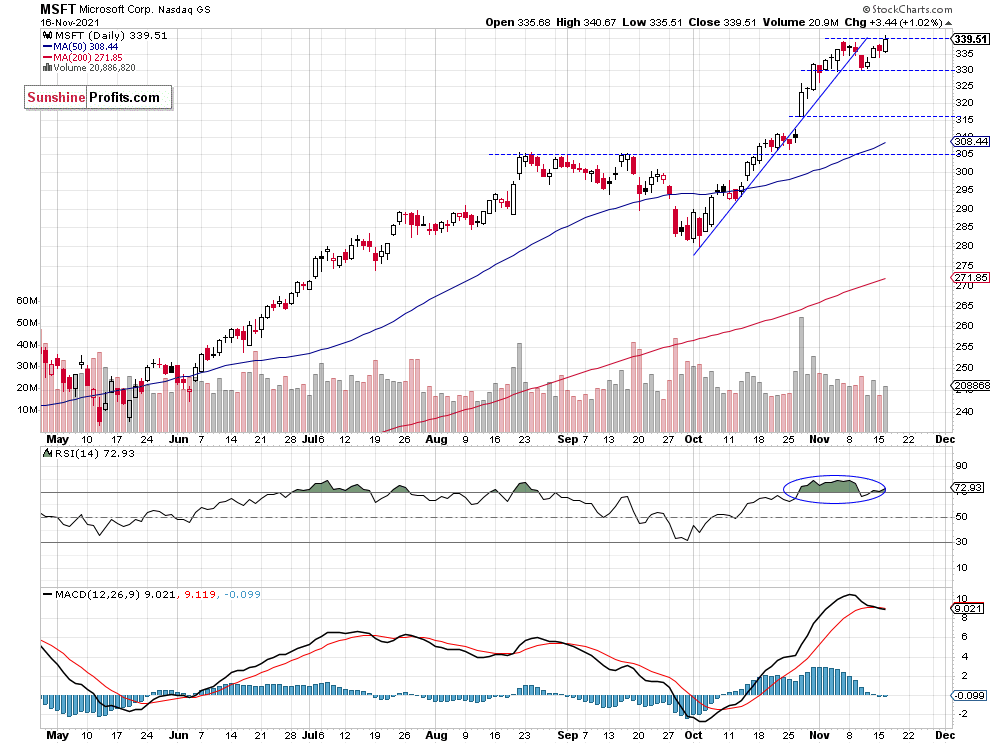
Let’s take a look at the two biggest stocks in the S&P 500 index, AAPL and MSFT. Apple accelerated its uptrend after breaking above the resistance level of around $152-154. It reached the new record high on Friday at $161.02. Microsoft slightly extended its recent advance, as it reached the new record high of $345.10. The two biggest megacap tech stocks reached new record highs, as we can see on their daily charts:
Conclusion
The S&P 500 index is expected to open 0.4% higher this morning. We will likely see some more short-term fluctuations along the record high level. For now, it looks like a short-term consolidation and a flat correction within an uptrend.
Here’s the breakdown:
- The S&P 500 is fluctuating along the 4,700 level. For now, it looks like a short-term consolidation following the October-November rally.
- Still no positions are justified from the risk/reward point of view.
Today's premium Stock Trading Alert includes details of our trading position. Interested in more exclusive updates? Join our premium Stock Trading Alerts newsletter and read all the details today.
Thank you.
Paul Rejczak,
Stock Trading Strategist
Sunshine Profits: Effective Investments through Diligence and Care -
S&P 500: More Uncertainty Following Overnight Record-Breaking Rally
November 19, 2021, 9:25 AMAvailable to premium subscribers only.
-
S&P 500: Another Attempt At Breaking Above 4,700
November 18, 2021, 9:21 AMAvailable to premium subscribers only.
-
S&P 500 Is Almost At New Record High, Will The Uptrend Continue?
November 17, 2021, 9:40 AMS&P 500 got close to its all-time high, as market mood turned bullish again. But the index retraced some of the rally. So will the uptrend continue?
For in-depth technical analysis of various stocks and a recap of today's Stock Trading Alert we encourage you to watch today's video.
The S&P 500 index gained 0.39% on Tuesday, Nov. 16, as it closed slightly above the 4,700 mark. The market reached the daily high of 4,714.95 before retracing some of the intraday advance. It got close to the Nov. 5 record high of 4,718.50. Last week it fell to the local low of 4,630.86 and it was almost 88 points or 1.86% below the record high.
The early November rally was not broad-based and it was driven by a handful of tech stocks like MSFT, NVDA, TSLA. The market seemed overbought in the short-term and it traded within a topping pattern. Then the index retraced some of that advance, as it fell the mentioned 88 points from the record high.
The nearest important support level remains at 4,630-4,650 and the next support level is at 4,600. On the other hand, the resistance level is at 4,700-4,720. The S&P 500 broke below its steep short-term upward trend line recently, as we can see on the daily chart (chart by courtesy of http://stockcharts.com):

Nasdaq Extended Its Short-Term Uptrend
Let’s take a look at the Nasdaq 100 chart. The technology index broke above the 16,000 level recently and it was trading at the new record high. The market accelerated higher above its short-term upward trend line. But last week it retraced some of the advance and it got back to the 16,000 level. Since then it has been advancing and yesterday it got back closer to the record high, as we can see on the daily chart:

Apple Above $150, Microsoft at New Record High
Let’s take a look at the two biggest stocks in the S&P 500 index, AAPL and MSFT. Apple broke above the $150 price level yesterday. However, it remains well below the early September record high. Microsoft stock retraced all of its recent decline and it reached the new record high of $340.67 yesterday, as we can see on their daily charts:

 Conclusion
The S&P 500 index is expected to open virtually flat this morning. We may see another attempt at breaking above the 4,700 level. However, the market will likely continue to fluctuate along that level following mixed economic data releases.
Here’s the breakdown:
- The S&P 500 bounced from its last week’s local low and it got back above the 4,700 level yesterday. It still looks like a short-term consolidation.
- Still no positions are justified from the risk/reward point of view.
Today's premium Stock Trading Alert includes details of our trading position. Interested in more exclusive updates? Join our premium Stock Trading Alerts newsletter and read all the details today.
Thank you.
Paul Rejczak,
Stock Trading Strategist
Sunshine Profits: Effective Investments through Diligence and Care -
S&P 500: Uncertainty Following the Recent Advance
November 16, 2021, 9:08 AMAvailable to premium subscribers only.
Free Gold &
Stock Market Newsletter
with details not available
to 99% investors
+ 7 days of Gold Alerts
Gold Alerts
More-
Status
New 2024 Lows in Miners, New Highs in The USD Index
January 17, 2024, 12:19 PM -
Status
Soaring USD is SO Unsurprising – And SO Full of Implications
January 16, 2024, 8:40 AM -
Status
Rare Opportunity in Rare Earth Minerals?
January 15, 2024, 2:06 PM

