

-
S&P 500: More Short-Term Volatility On Covid News
November 30, 2021, 9:01 AMAvailable to premium subscribers only.
-
Stocks Will Rebound After Friday’s Rout, but Is the Correction Over?
November 29, 2021, 9:21 AMThe S&P 500 sold off on Friday after news about the new Covid variant. Today we will likely see a rebound but the short-term picture remains bearish.
For in-depth technical analysis of various stocks and a recap of today's Stock Trading Alert we encourage you to watch today's video.
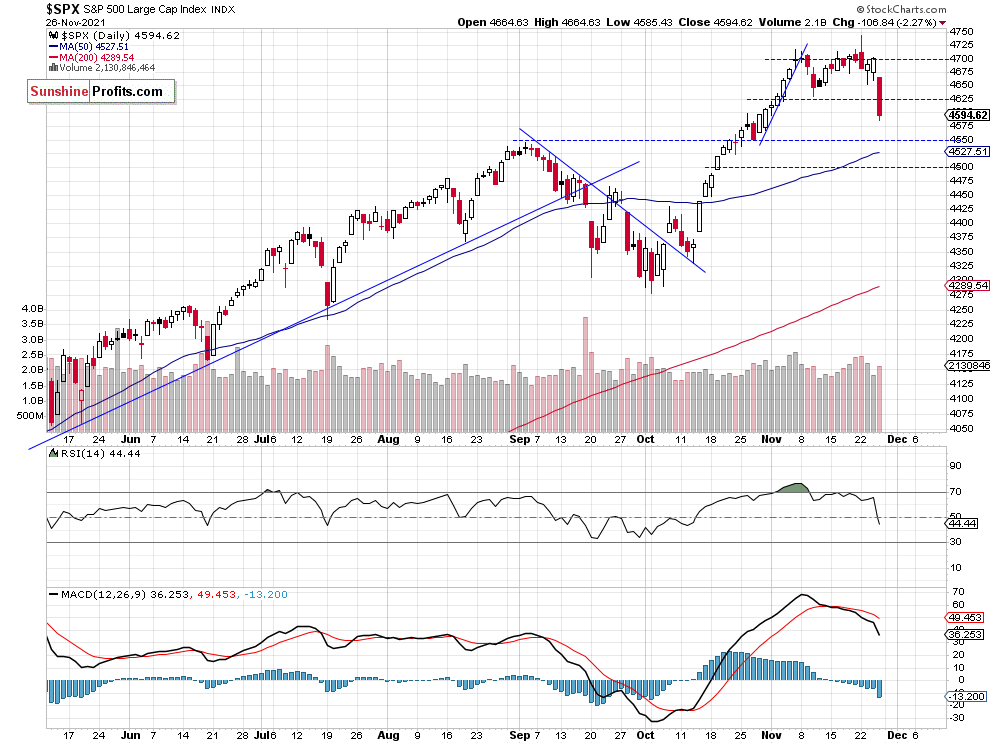
The S&P 500 index lost 2.27% on Friday, Nov. 26, as investors reacted to the news about new Covid variant detected in South Africa. The market broke below its recent local lows and it got away from the 4,700 level. The Friday’s trading action looked like a meaningful downward reversal.
The nearest important support level is now at 4,550-4,580. On the other hand, the resistance level is at 4,650, marked by the recent local lows. The S&P 500 retraced most of its early November advance, as we can see on the daily chart (chart by courtesy of http://stockcharts.com):

Nasdaq 100 Fell Closer to 16,000
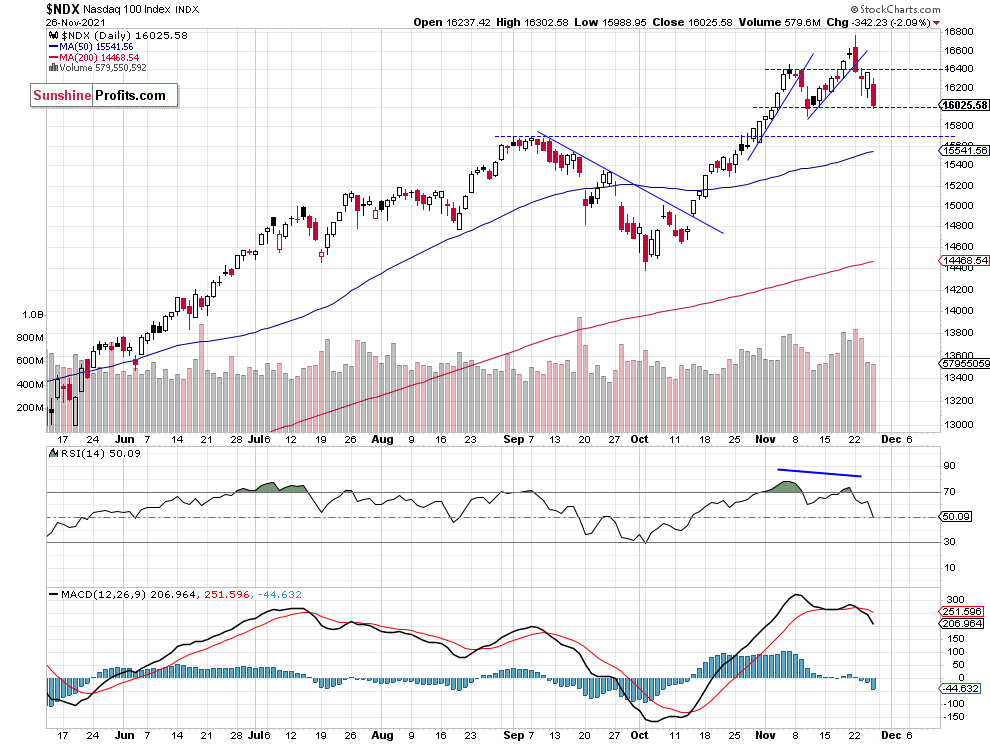
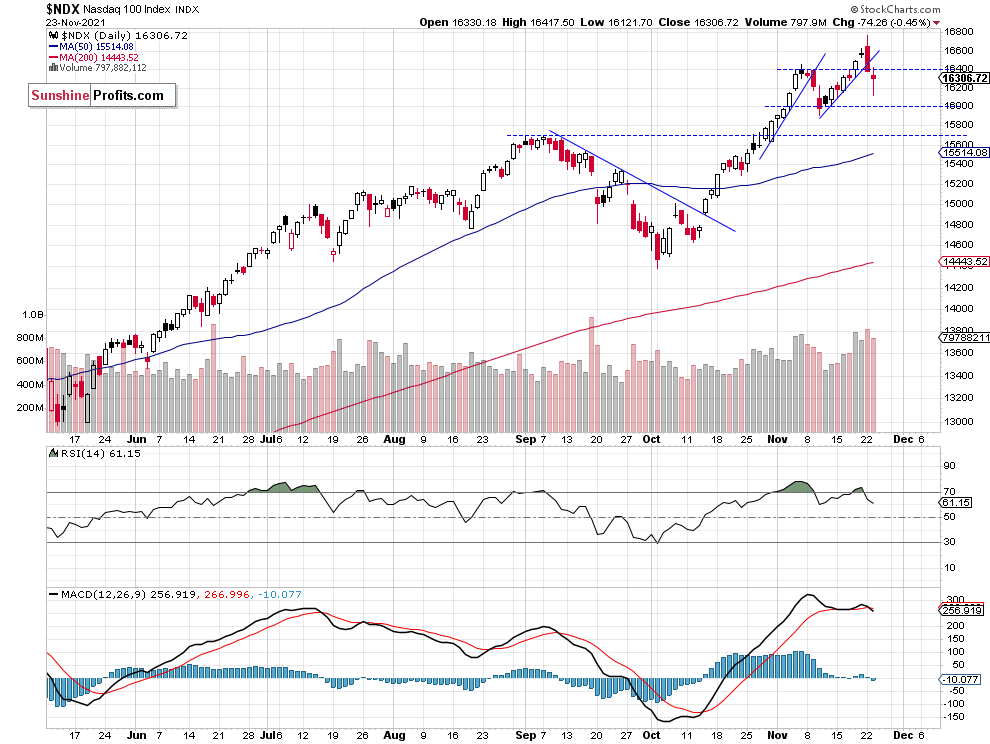
Let’s take a look at the Nasdaq 100 chart. The technology index remained relatively stronger than the broad stock market on Friday, as it didn’t break below the early November local low. However, it got close to the 16,000 level and it retraced almost 800 points from its last Monday’s new record high of 16,764.85. The index closed above the 16,000 mark on Friday, as we can see on the daily chart:

Apple Is At the Previous High
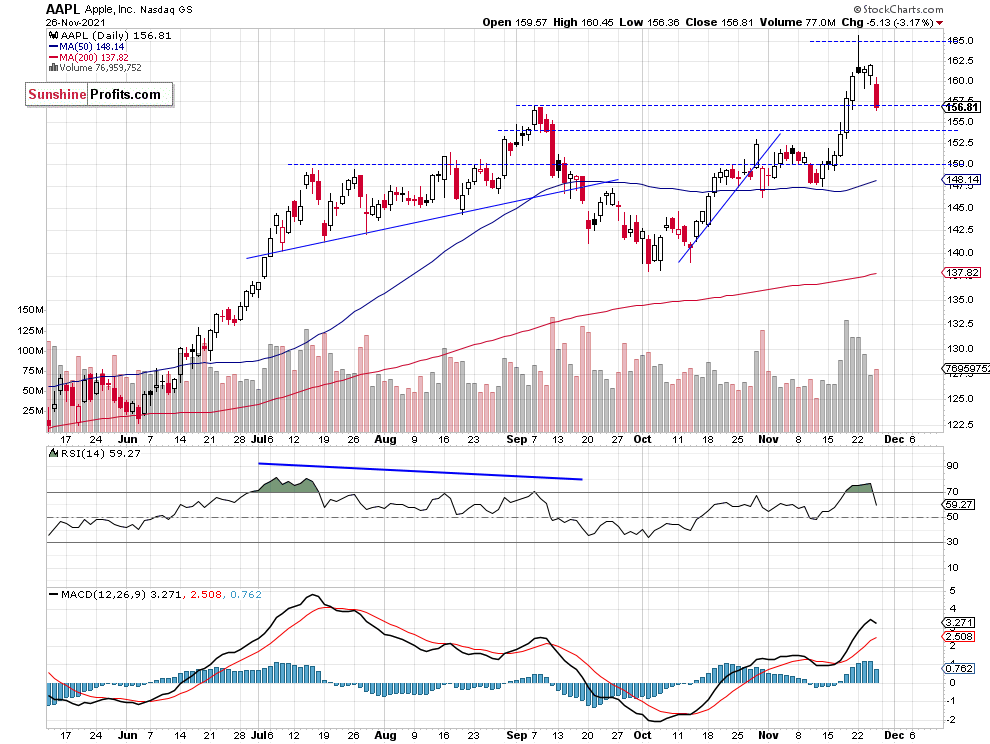
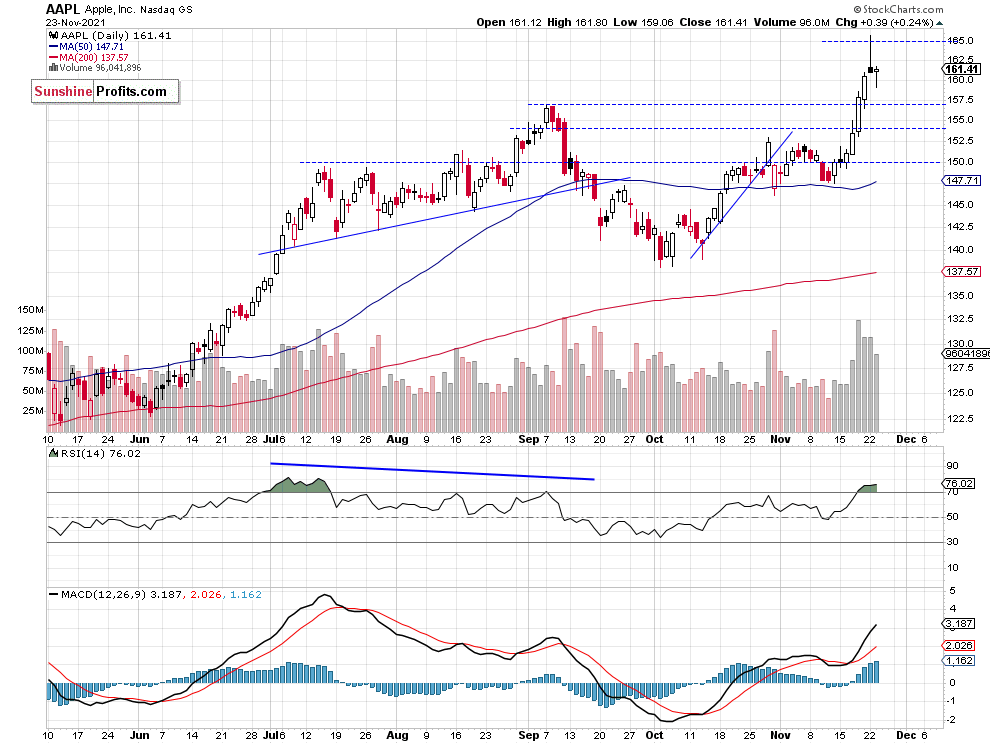
Let’s take a look at biggest stock in the S&P 500 index: AAPL. Apple accelerated its uptrend a week ago on Monday and it reached the new record high of $165.70. However, it retraced almost all of its intraday advance that day. On Friday it got back to a potential support level of around $157. For now, it looks like a downward correction.

Conclusion
The S&P 500 index is expected to open 1.0% higher this morning, as global markets are shrugging off the new Covid fears. We will likely see an intraday consolidation following higher opening. The broad stock market index may enter a flat correction within a short-term downtrend.
Here’s the breakdown:
- The S&P 500 traded within a short-term topping pattern last week and on Friday it suffered an over 2% sell-off.
- A speculative short position is still justified from the risk/reward perspective.
- We are expecting a 5% correction.
Today's premium Stock Trading Alert includes details of our trading position. Interested in more exclusive updates? Join our premium Stock Trading Alerts newsletter and read all the details today.
Thank you.
Paul Rejczak,
Stock Trading Strategist
Sunshine Profits: Effective Investments through Diligence and Care -
Stocks Will Sell Off, but Is This a Dip-Buying Opportunity?
November 26, 2021, 8:57 AMAvailable to premium subscribers only.
-
Is the S&P 500 Topping or Just Consolidating?
November 24, 2021, 9:12 AMThe S&P 500 continues to fluctuate along the 4,700 level. So is this a topping pattern or just a flat correction before another leg up?
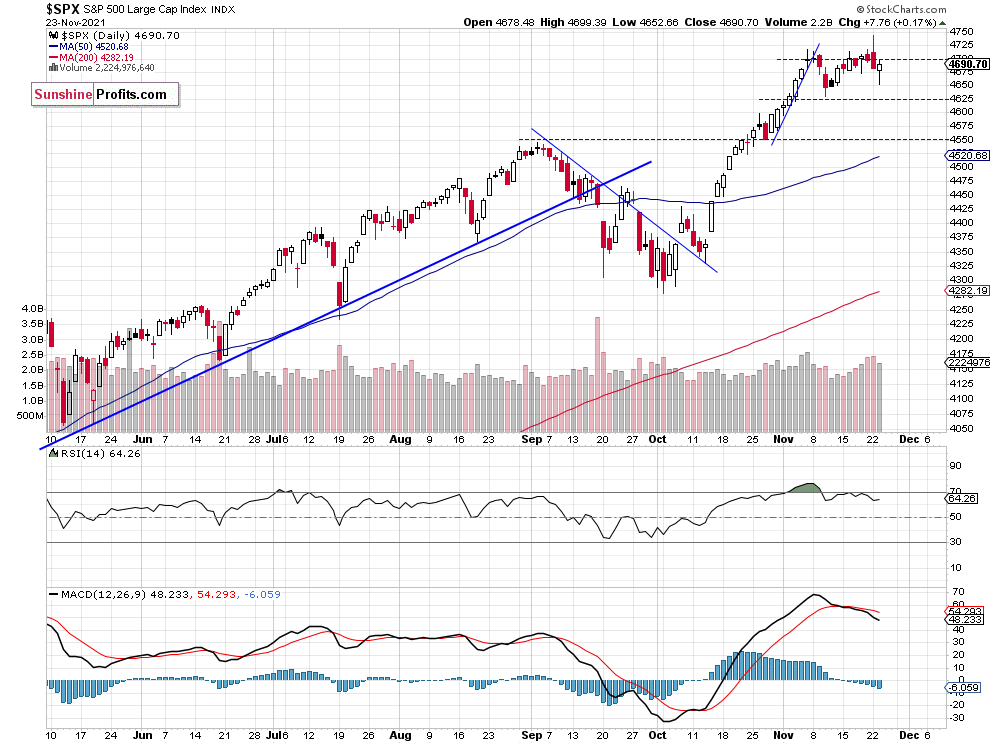
The S&P 500 index extended its Monday’s decline yesterday, as it fell to the daily low of 4,652.66. But it closed 0.17% higher following an intraday rebound. The market rebounded to the 4,700 level again. The broad stock market keeps trading within an over two-week-long consolidation. For now, it looks like a flat correction within an uptrend. However, it may also be a topping pattern before some more meaningful downward reversal.
The nearest important support level remains at 4,630-4,650 and the next support level is at 4,600. On the other hand, the resistance level is at 4,700-4,750. The S&P 500 continues to trade along the 4,700 level, as we can see on the daily chart (chart by courtesy of http://stockcharts.com):

Nasdaq Broke Below the Trend Line
Let’s take a look at the Nasdaq 100 chart. The technology index reached the new record high on Monday, led by the megacap tech stock rallies, but it reversed its intraday course and yesterday it fell below the 16,200 level. The index broke below its short-term upward trend line, as we can see on the daily chart:

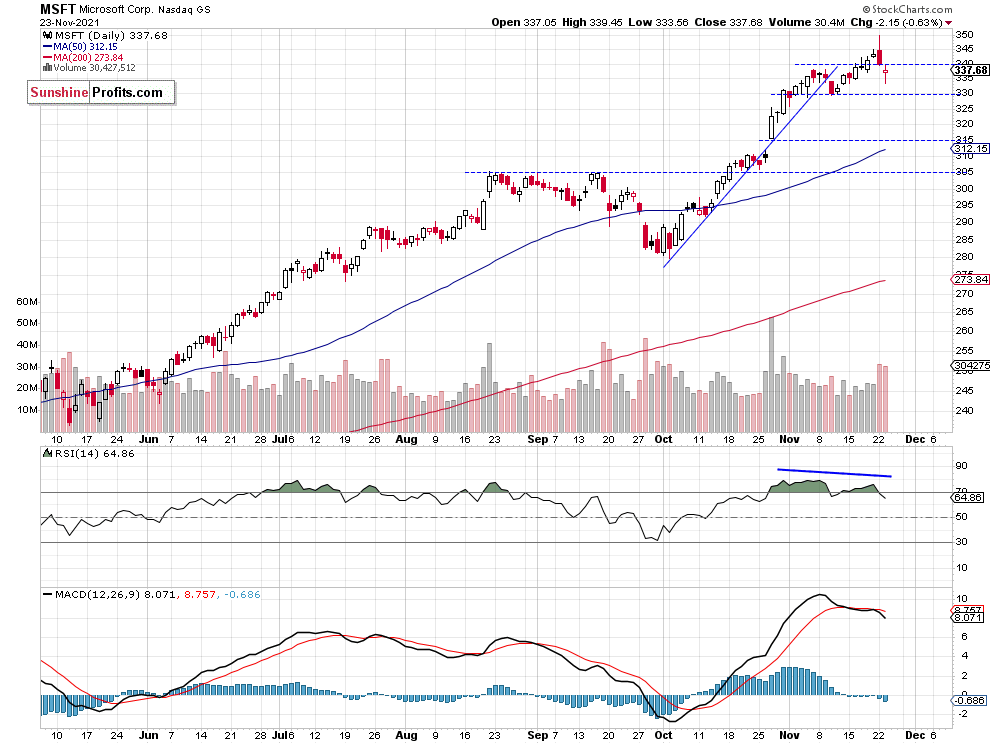
Apple and Microsoft – a Potential Reversal
Let’s take a look at the two biggest stocks in the S&P 500 index, AAPL and MSFT. Apple accelerated its uptrend on Monday and Microsoft slightly extended its recent advance. Both reached the record highs before reversing lower. Yesterday they were mixed, and today we may see some more short-term uncertainty.

 Conclusion
The S&P 500 index is expected to open 0.4% lower this morning following a series of economic data releases. The market will wait for some more economic data releases - the Core PCE Price Index, Personal Income/ Personal Spending at 10:00 a.m., and the FOMC Meeting Minutes at 2:00 p.m. We may see a short-term consolidation ahead of tomorrow’s holiday break and the long holiday weekend.
So overall, the broad stock market may be trading within a topping pattern. However there have been no confirmed negative signals so far.
Nevertheless, we decided to open a speculative short position yesterday, and we are expecting a 5% correction from the current levels.
Here’s the breakdown:
- The S&P 500 backed from the new record high on Monday and it looked like a short-term or medium-term topping pattern.
- A speculative short position is justified from the risk/reward perspective.
- We are expecting a 5% correction from the current levels.
Today's premium Stock Trading Alert includes details of our trading position. Interested in more exclusive updates? Join our premium Stock Trading Alerts newsletter and read all the details today.
Thank you.
Paul Rejczak,
Stock Trading Strategist
Sunshine Profits: Effective Investments through Diligence and Care -
Stocks – Was Yesterday’s Reversal a Meaningful One?
November 23, 2021, 8:38 AMAvailable to premium subscribers only.
Free Gold &
Stock Market Newsletter
with details not available
to 99% investors
+ 7 days of Gold Alerts
Gold Alerts
More-
Status
New 2024 Lows in Miners, New Highs in The USD Index
January 17, 2024, 12:19 PM -
Status
Soaring USD is SO Unsurprising – And SO Full of Implications
January 16, 2024, 8:40 AM -
Status
Rare Opportunity in Rare Earth Minerals?
January 15, 2024, 2:06 PM

