

-
S&P 500 Is Poised to Open Much Lower, Is This a Dip-buying Opportunity?
September 20, 2021, 8:42 AMStocks are breaking down! The S&P 500 index fell almost 1% on Friday and today it is poised to open 1.8% lower. Are we getting close to a local low?
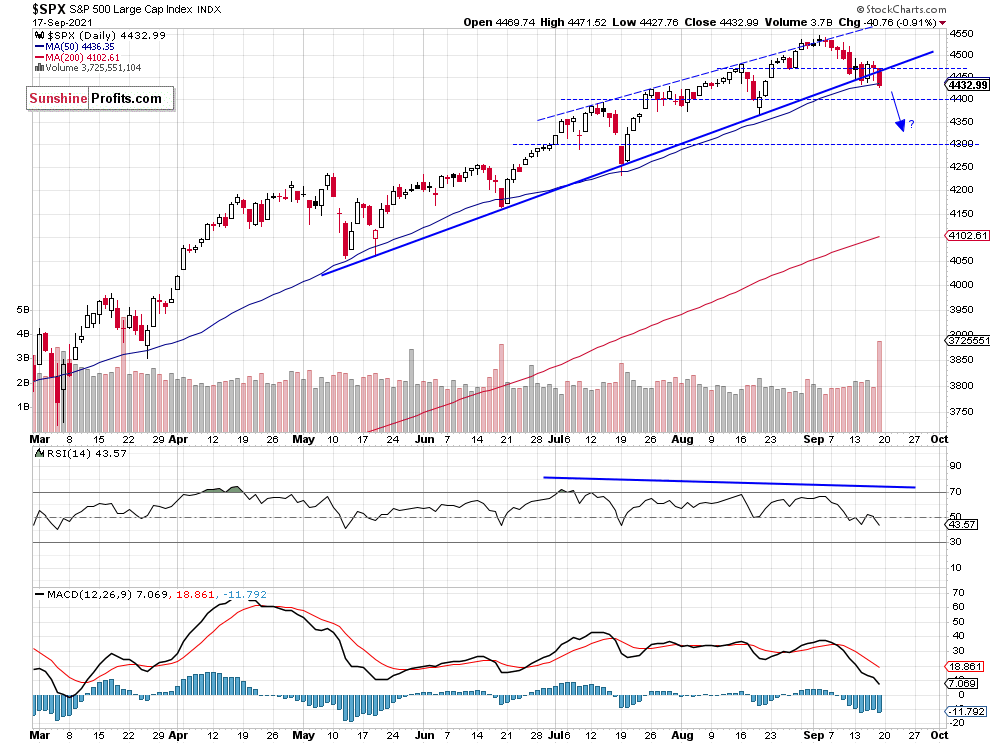
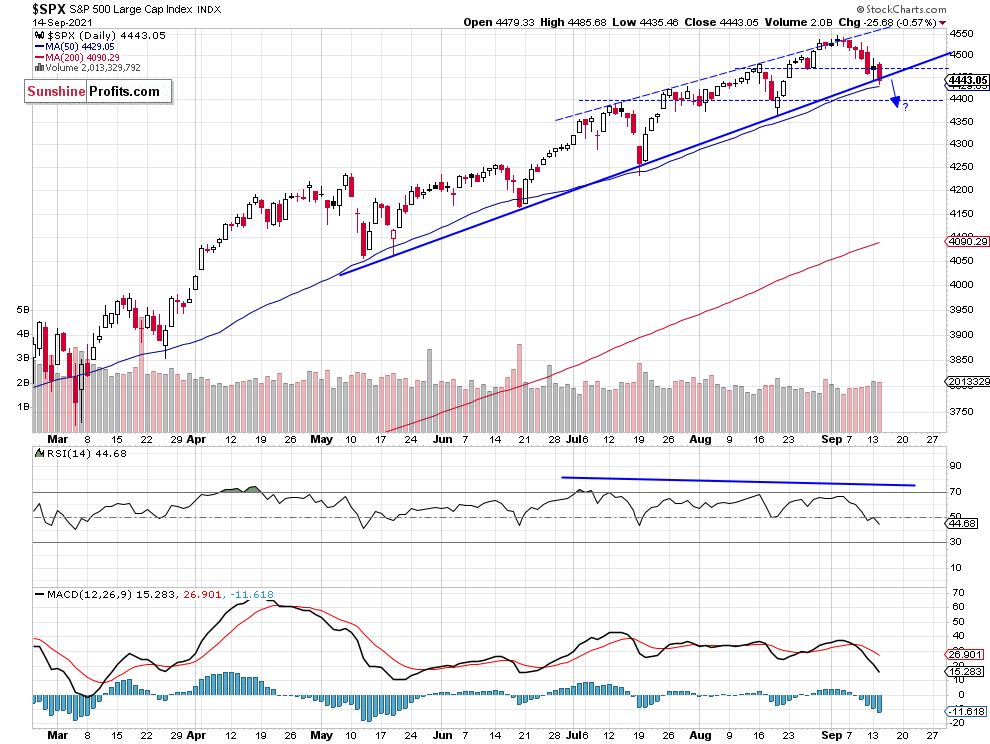
The broad stock market index broke below its short-term consolidation on Friday, as the S&P 500 index fell below its recent local lows along 4,450 price level. On September 2 the index reached a new record high of 4,545.85. Since then it has lost almost 120 points. This morning stocks are expected to open much lower following big declines in Asia and Europe after news about Evergrande Real Estate Group crisis in China.
The nearest important support level of the broad stock market index is now at 4,300-4,350 and the next support level is at 4,200. On the other hand, the nearest important resistance level is now at 4,400-4,450, marked by the previous support level. The S&P 500 broke below its over four-month-long upward trend line, as we can see on the daily chart (chart by courtesy of http://stockcharts.com):

Dow Jones Is Leading Lower
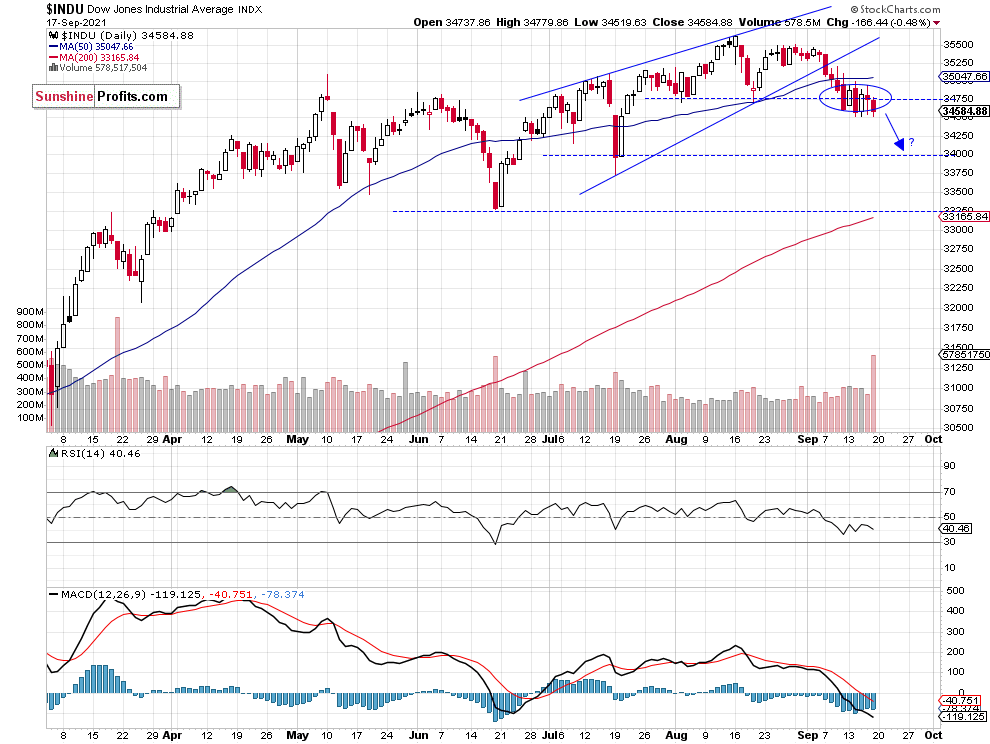
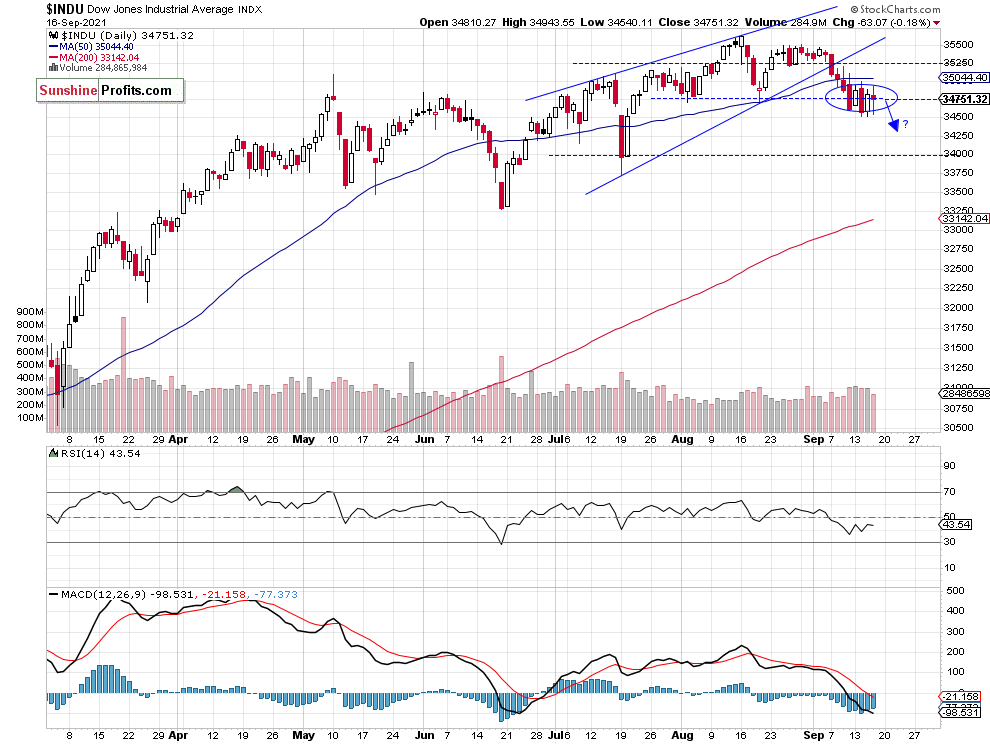
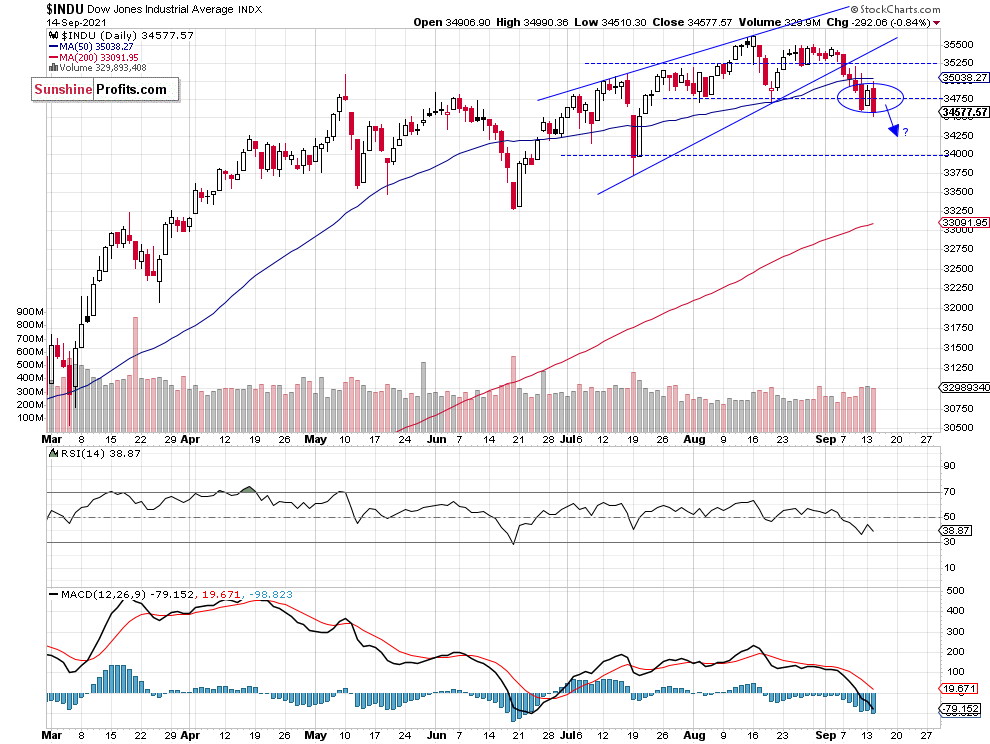
Let’s take a look at the Dow Jones Industrial Average chart. The blue-chip index broke below a potential two-month-long rising wedge downward reversal pattern recently. It remained relatively weaker in August - September, as it didn’t reach a new record high like the S&P 500 and the Nasdaq. Today it may sell off to 34,000 level or lower. The next support level is at around 33,250-33,500 and the resistance level is at 34,500, marked by the recent support level, as we can see on the daily chart:

Apple Breaks Below Upward Trend Line
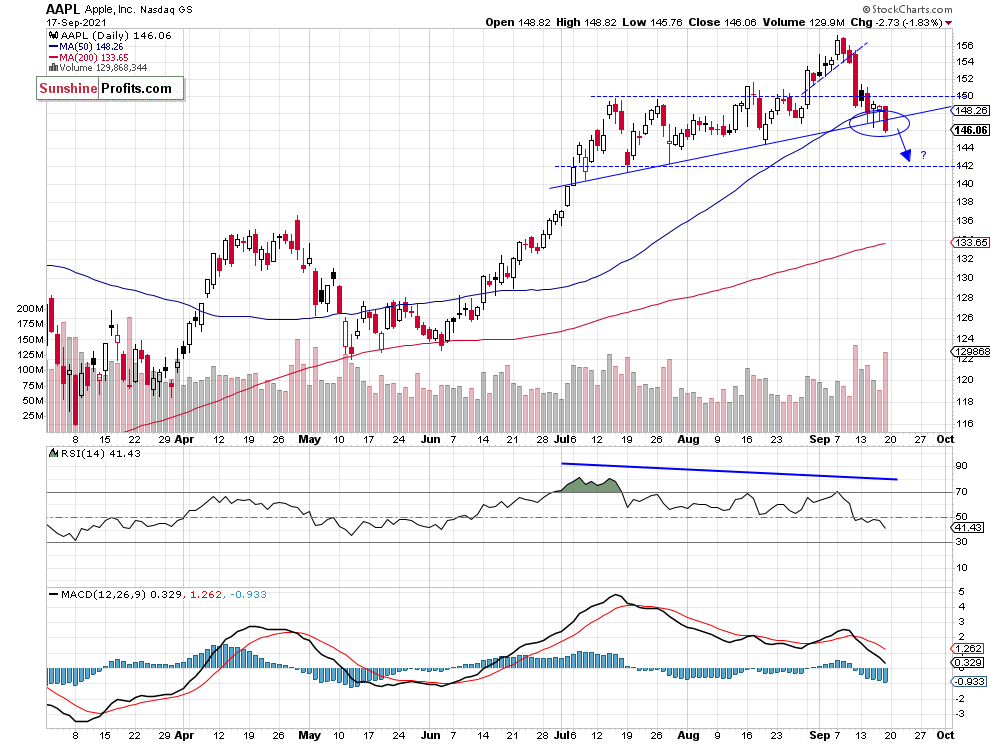
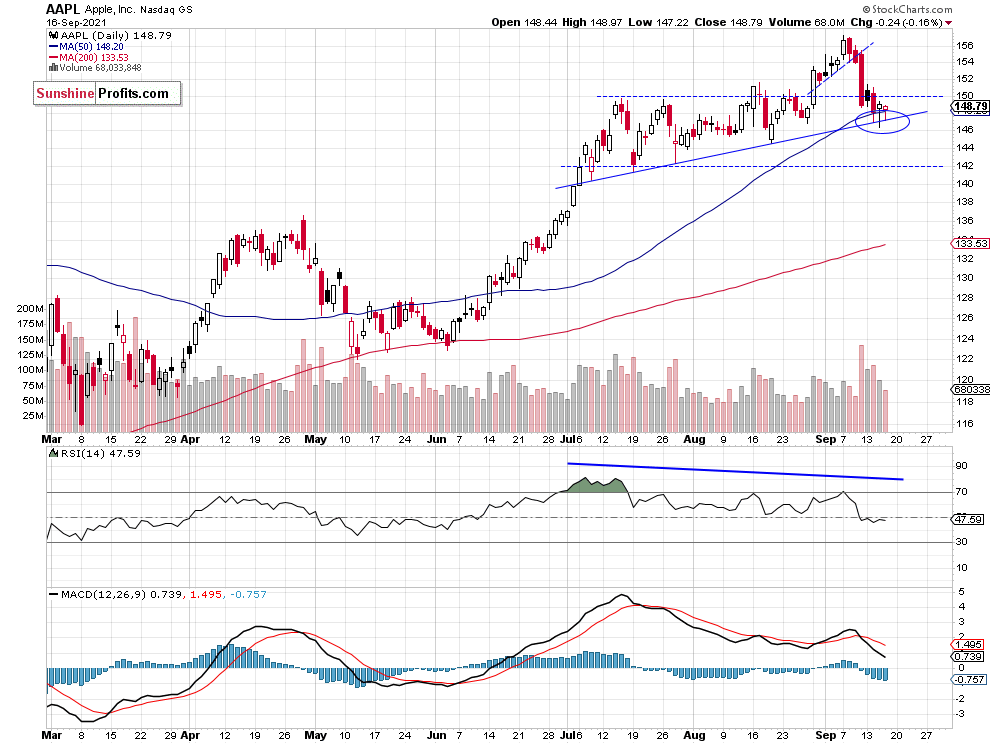
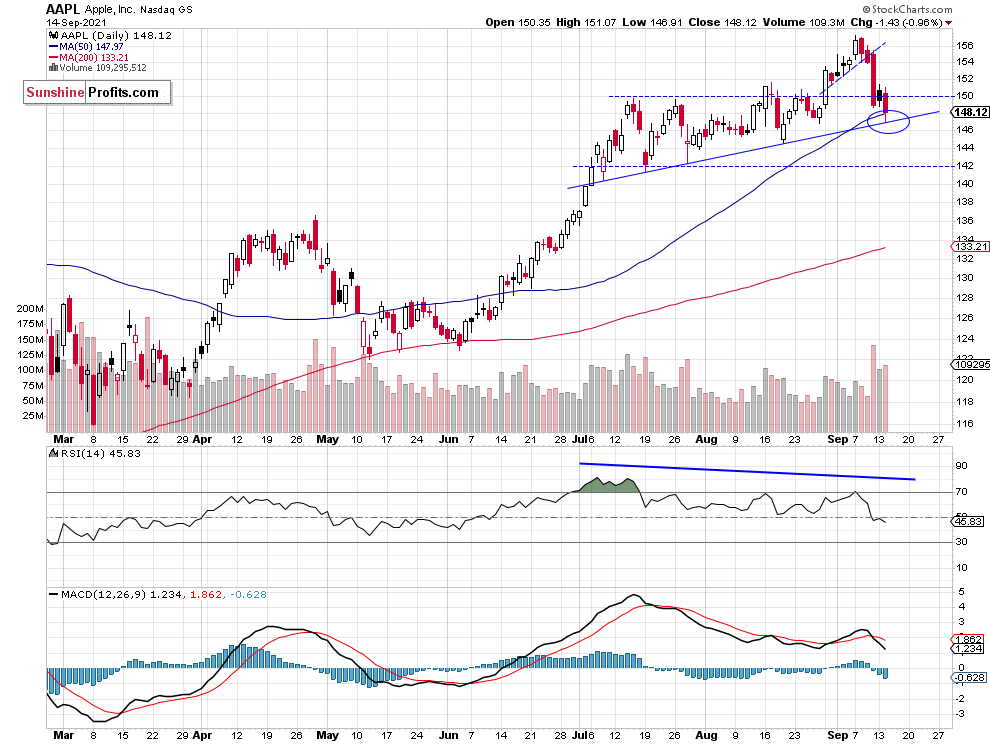
Apple stock weighs around 6.3% in the S&P 500 index, so it is important for the whole broad stock market picture. In early September it reached a new record high of $157.26. And since then it has been declining. So it looked like a bull trap trading action. We can still see negative technical divergences between the price and indicators and a potential topping pattern. The stock is breaking below an over two-month-long upward trend line.

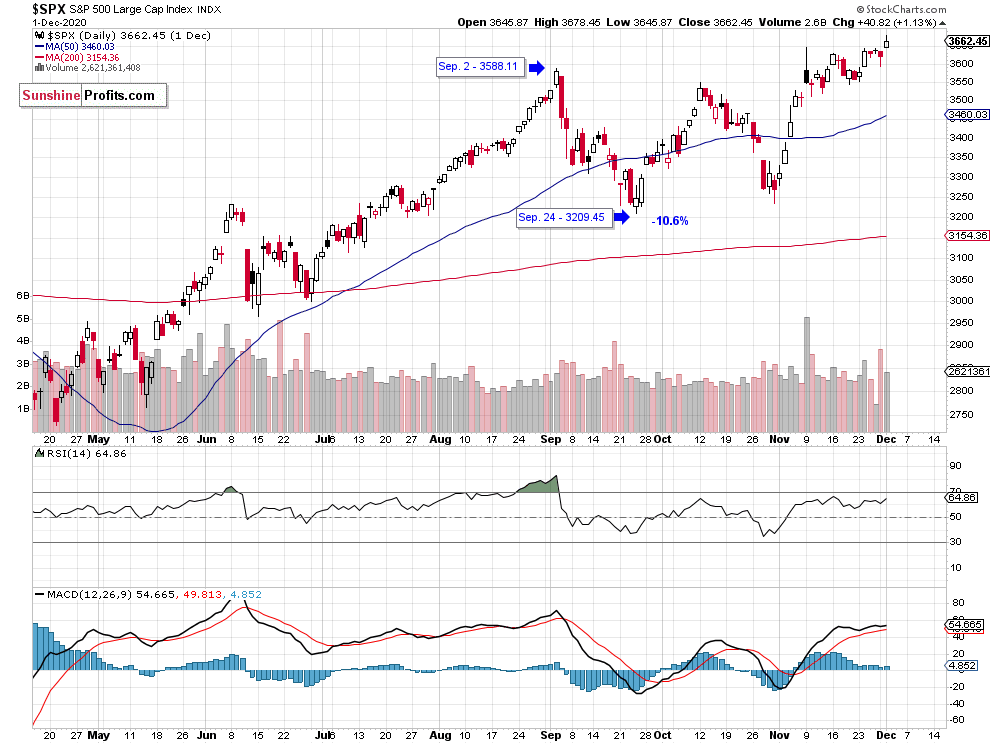
September Last Year – S&P 500 Fell Almost 11%
In 2020, the S&P 500 index reached a local high of 3,588.11 on September 2 and in just three weeks it fell 10.6% to local low of 3,209.45 on September 24. This year, September’s downward correction has started from the new record high of 4,545.85 on September 3, so there is a striking similarity between those two trading actions.

Conclusion
The S&P 500 index broke below its short-term consolidation on Friday and today it will most likely accelerate the downtrend from the early September record high. However, later in the day we may see some short-term/ intraday bottoming trading action.
The market seems overbought, and we may see some more profound downward correction soon. Therefore, we think that the short position is justified from the risk/reward perspective.
Here’s the breakdown:
- The market is extending its downtrend today, as the S&P 500 index is likely to open much below 4,400 level.
- Our speculative short position is still justified from the risk/reward perspective.
- We are expecting a 5% or bigger correction from the record high.
Today's premium Stock Trading Alert includes details of our trading position. Interested in more exclusive updates? Join our premium Stock Trading Alerts newsletter and read all the details today.
Thank you.
Paul Rejczak,
Stock Trading Strategist
Sunshine Profits: Effective Investments through Diligence and Care -
Will Quadruple Witch Send Stock Prices Lower?
September 17, 2021, 9:29 AMStocks are going sideways since last Friday. Will they break higher and go back to the record high? Or the opposite? It still doesn’t look bullish.
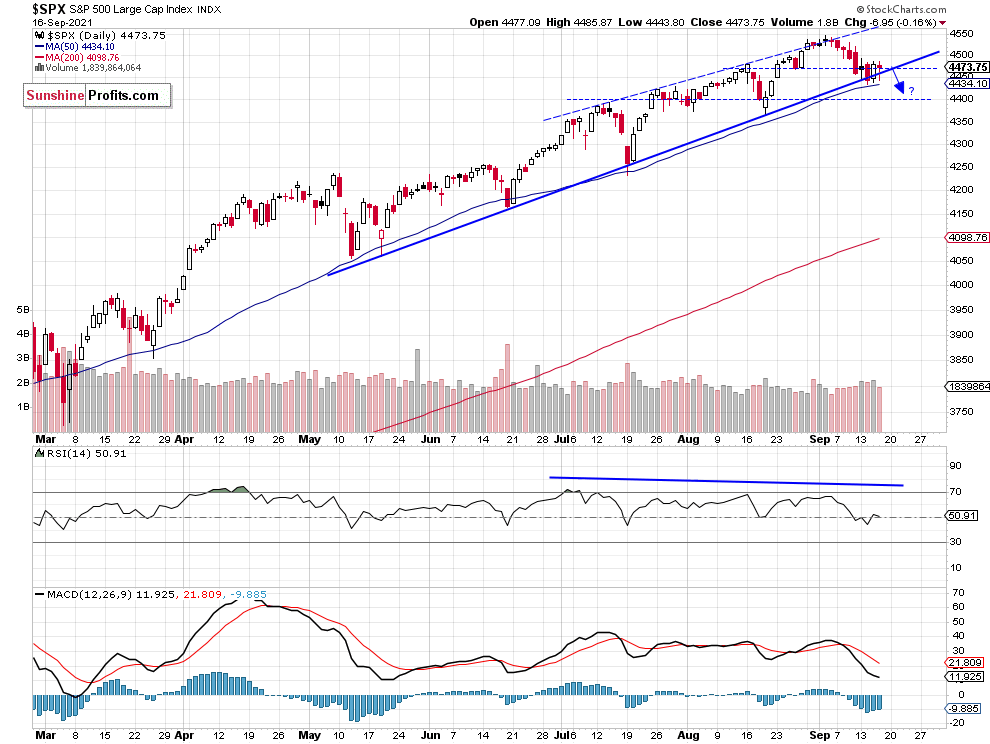
The broad stock market index lost 0.16% on Thursday as it fluctuated within a short-term consolidation following last week’s declines. On September 2 the index reached a new record high of 4,545.85. Since then it has lost over 110 points. This morning stocks are expected to open virtually flat again following a pre-session rebound from overnight lows.
The index remains elevated after the recent run-up, so we may see more profound profit-taking action at some point.
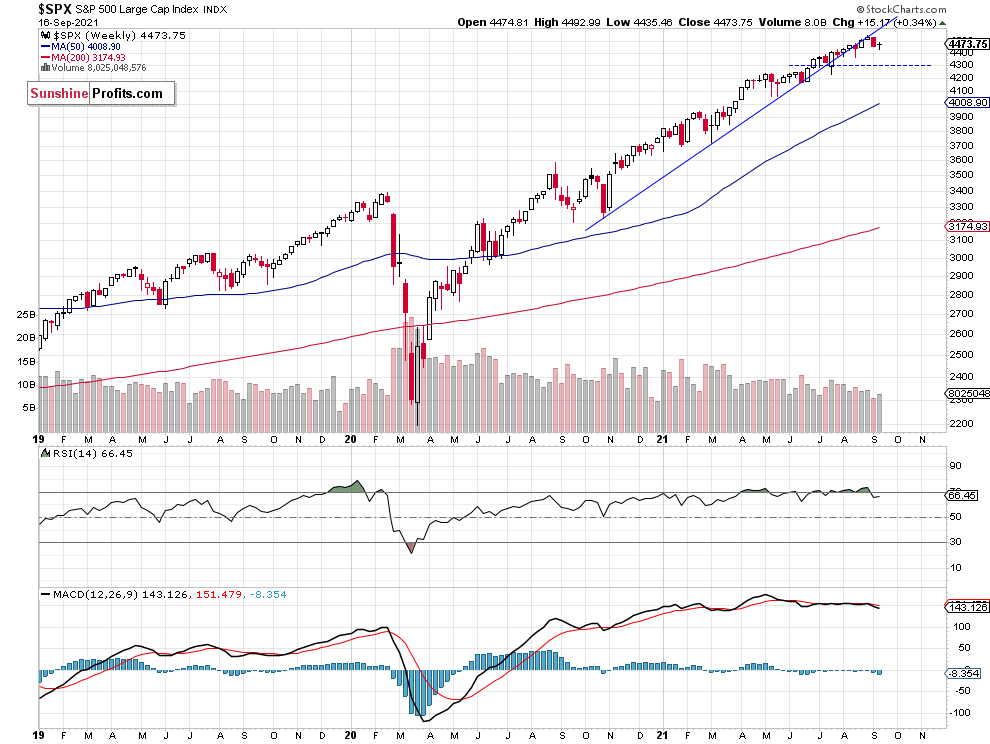
The nearest important support level of the broad stock market index is now at 4,435-4,450 and the next support level is at 4,400-4,410. On the other hand, the nearest important resistance level is now at 4,490-4,500, marked by the previous support level. The S&P 500 bounced off its over four-month-long upward trend line, as we can see on the daily chart (chart by courtesy of http://stockcharts.com):

S&P 500’s Medium-Term Downward Reversal?
The S&P 500 index broke below its medium-term upward trend line a few weeks ago. However, it is still relatively close to the record high. The nearest important support level is at 4,300, as we can see on the weekly chart:

Dow Jones Trades Within a Consolidation
Let’s take a look at the Dow Jones Industrial Average chart. The blue-chip index broke below a potential two-month-long rising wedge downward reversal pattern recently. It remained relatively weaker in August - September, as it didn’t reach a new record high like the S&P 500 and the Nasdaq. The support level is now at around 34,500 and the near resistance level is at 35,000, marked by the recent support level, as we can see on the daily chart:

Apple at Support Level
Apple stock weighs around 6.3% in the S&P 500 index, so it is important for the whole broad stock market picture. Last week it reached a new record high of $157.26. And since then it has been declining. So it looked like a bull trap trading action. On Friday the stock accelerated its downtrend following an unfavorable federal judge's ruling. We can still see negative technical divergences between the price and indicators and a potential topping pattern. The stock is at an over two-month-long upward trend line – it’s a ‘make or break’ situation.

Conclusion
The S&P 500 index continued to trade within a short-term consolidation yesterday. It’s been a week since the market reached the current price levels. So is this a flat correction within a downtrend or some bottoming pattern? Today we will most likely see another flat opening of the trading session – later in the day we may see some more volatility because of a quarterly derivatives expiration known as ‘quadruple witching Friday’.
The market seems overbought, and we may see some more profound downward correction soon. Therefore, we think that the short position is justified from the risk/reward perspective.
Here’s the breakdown:
- The market retraced more of its recent advances this week, as the S&P 500 index extended its decline below 4,450 level.
- Our speculative short position is still justified from the risk/reward perspective.
- We are expecting a 5% or bigger correction from the record high.
Today's premium Stock Trading Alert includes details of our trading position. Interested in more exclusive updates? Join our premium Stock Trading Alerts newsletter and read all the details today.
Thank you.
Paul Rejczak,
Stock Trading Strategist
Sunshine Profits: Effective Investments through Diligence and Care -
S&P 500 In a Rebound Mode, End of Correction Move Down?
September 16, 2021, 8:57 AMAvailable to premium subscribers only.
-
S&P 500: Striking Similarity to the September Last Year
September 15, 2021, 8:37 AMStocks extended their short-term downtrend as the S&P 500 index fell slightly below its Monday’s daily low. Is more downside trading action coming?
The broad stock market index fell to the daily low of 4,435.46 on Tuesday and it was the lowest since August 20. On September 2 the index reached a new record high of 4,545.85. Since then it has lost over 110 points. This morning stocks are expected to open virtually flat.
The index remains elevated after the recent run-up, so we may see some more profound profit-taking action at some point.
The nearest important support level of the broad stock market index is at 4,435 and the next support level is at 4,400-4,410. On the other hand, the nearest important resistance level is now at 4,465-4.475, marked by the recent support level. The S&P 500 got back close to its over four-month-long upward trend line, as we can see on the daily chart (chart by courtesy of http://stockcharts.com):

Dow Jones – Short-term Consolidation
Let’s take a look at the Dow Jones Industrial Average chart. The blue-chip index broke below a potential two-month-long rising wedge downward reversal pattern last week. It remained relatively weaker, as it didn’t reach a new record high like the S&P 500 and the Nasdaq. The support level is now at around 34,500 and the near resistance level is at 34,750, marked by the recent support level, as we can see on the daily chart:

September Last Year – S&P 500 Fell Almost 11%
In 2020, the S&P 500 index reached a local high of 3,588.11 on September 2 and in just three weeks it fell 10.6% to local low of 3,209.45 on September 24. This year, September’s downward correction has started at the new record high of 4,545.85 on September 3, so there is a striking similarity between those two trading actions. However, the index is just 2.4% down this time.

Apple Stock at Trend Line
Apple stock weighs around 6.3% in the S&P 500 index, so it is important for the whole broad stock market picture. Last week it reached a new record high of $157.26. Since then it has been declining. So it looks like a bull trap trading action. On Friday the stock accelerated its downtrend following an unfavorable federal judge's ruling. We can still see negative technical divergences between the price and indicators and a potential topping pattern. The two-month-long upward trend line remains at around $147.

Conclusion
Yesterday, the S&P 500 index extended its short-term downtrend following breaking below 4,500 level on Friday. For now, it still looks like a correction within an uptrend. Today we will most likely see a flat opening of the trading session – we may see some more short-term consolidation.
The market seems overbought, and we may see some more profound downward correction soon. Therefore, we think that the short position is justified from the risk/reward perspective.
Here’s the breakdown:
- The market retraced more of its recent advances this week, as the S&P 500 index extended its decline below 4,450 level.
- Our speculative short position is still justified from the risk/reward perspective.
- We are expecting a 5% or bigger correction from the record high.
Today's premium Stock Trading Alert includes details of our trading position. Interested in more exclusive updates? Join our premium Stock Trading Alerts newsletter and read all the details today.
Thank you.
Paul Rejczak,
Stock Trading Strategist
Sunshine Profits: Effective Investments through Diligence and Care -
S&P 500 Fell to Trend Line Again - Support May Not Hold
September 14, 2021, 8:22 AMAvailable to premium subscribers only.

Free Gold &
Stock Market Newsletter
with details not available
to 99% investors
+ 7 days of Gold Alerts
Gold Alerts
More-
Status
New 2024 Lows in Miners, New Highs in The USD Index
January 17, 2024, 12:19 PM -
Status
Soaring USD is SO Unsurprising – And SO Full of Implications
January 16, 2024, 8:40 AM -
Status
Rare Opportunity in Rare Earth Minerals?
January 15, 2024, 2:06 PM

