

-
Stocks Bounced, but Bulls Are Not Out of the Woods Yet
October 4, 2021, 9:27 AMStocks bounced from the new local low on Friday. Is this the end of a downward correction or just some consolidation before another leg down?
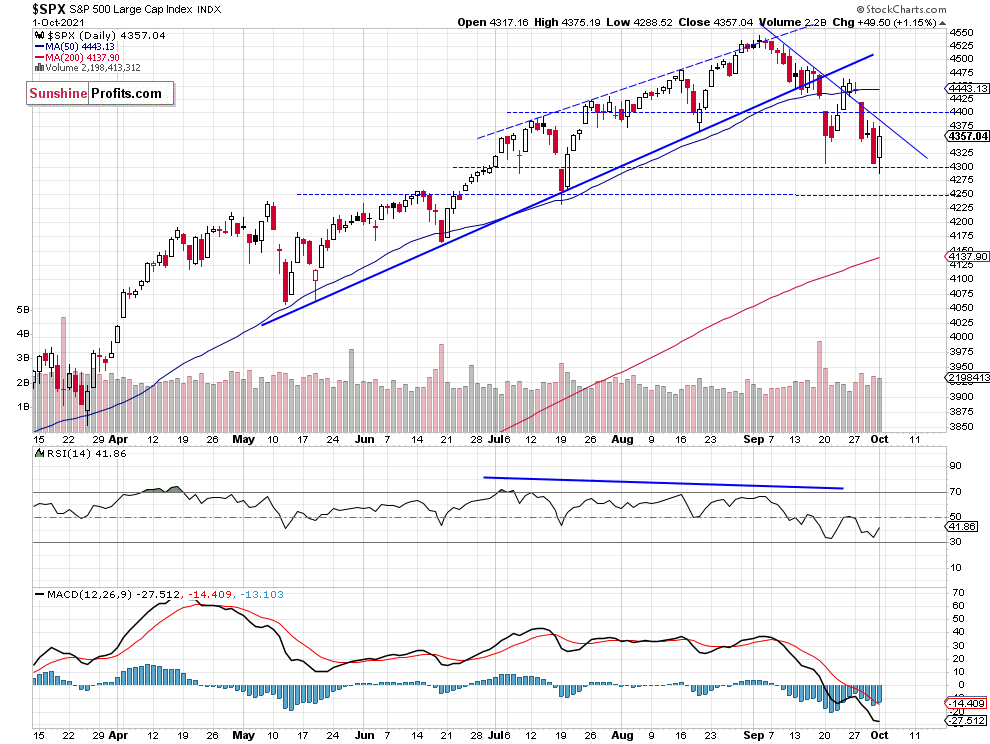
The S&P 500 index slightly extended its short-term downtrend on Friday, as it reached the local low of 4,288.52 right after the opening. But bulls took over and the market gained 1.15% on a daily basis. It came back above 4,350. This morning the market is expected to open slightly lower and we may see more short-term consolidation.
The nearest important support level of the broad stock market index is now at 4,300-4,320, marked by the recent local lows. The next support level is at around 4,250. On the other hand, the resistance level is at 4,380-4,400. The S&P 500 continues to trade below its month-long downward trend line, as we can see on the daily chart (chart by courtesy of http://stockcharts.com):

Dow Jones Didn’t Reach a New Low
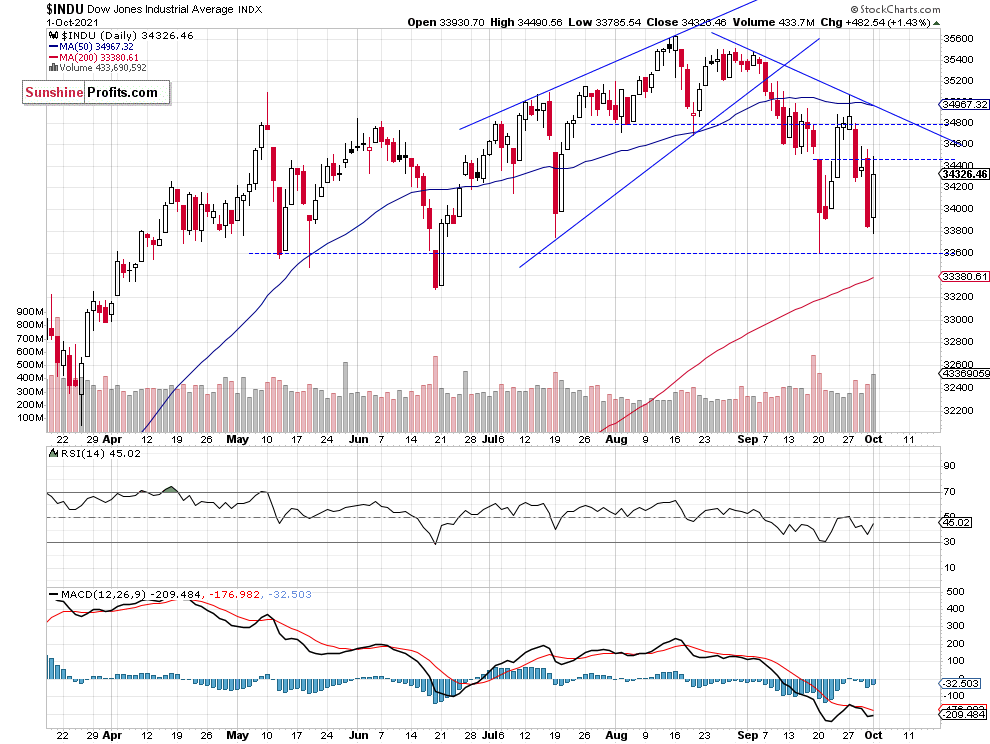
Let’s take a look at the Dow Jones Industrial Average chart. In early September the blue-chip index broke below a two-month-long rising wedge downward reversal pattern. Last week it got back closer to its mid-September local low. However, unlike the broad stock market’s gauge, it managed to stay above that support level. The nearest important resistance level is at around 34,500, as we can see on the daily chart:

Apple is Still at Support Level
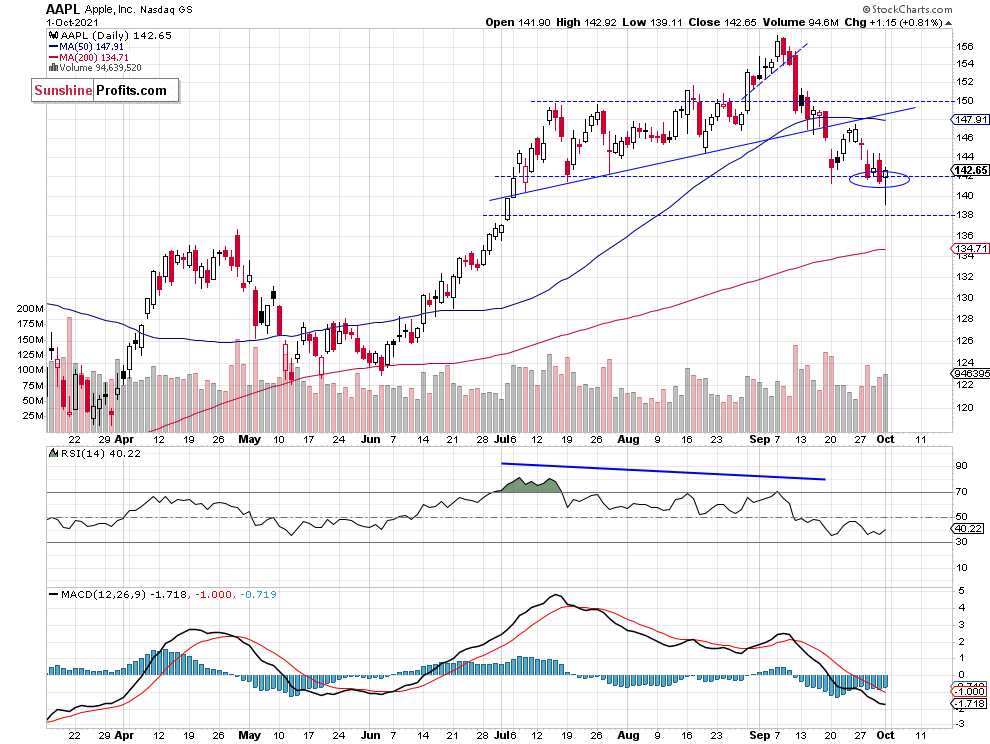
Apple stock weighs around 6.1% in the S&P 500 index, so it is important for the whole broad stock market picture. Since early September it has been declining from the record high. Recently the stock sold off to the previous local lows and on Friday it sold off to around $139 before going back up. The $142 price level is acting as a support level, so it is still a “make or break” situation.

We Closed Our Profitable Short Position on Friday
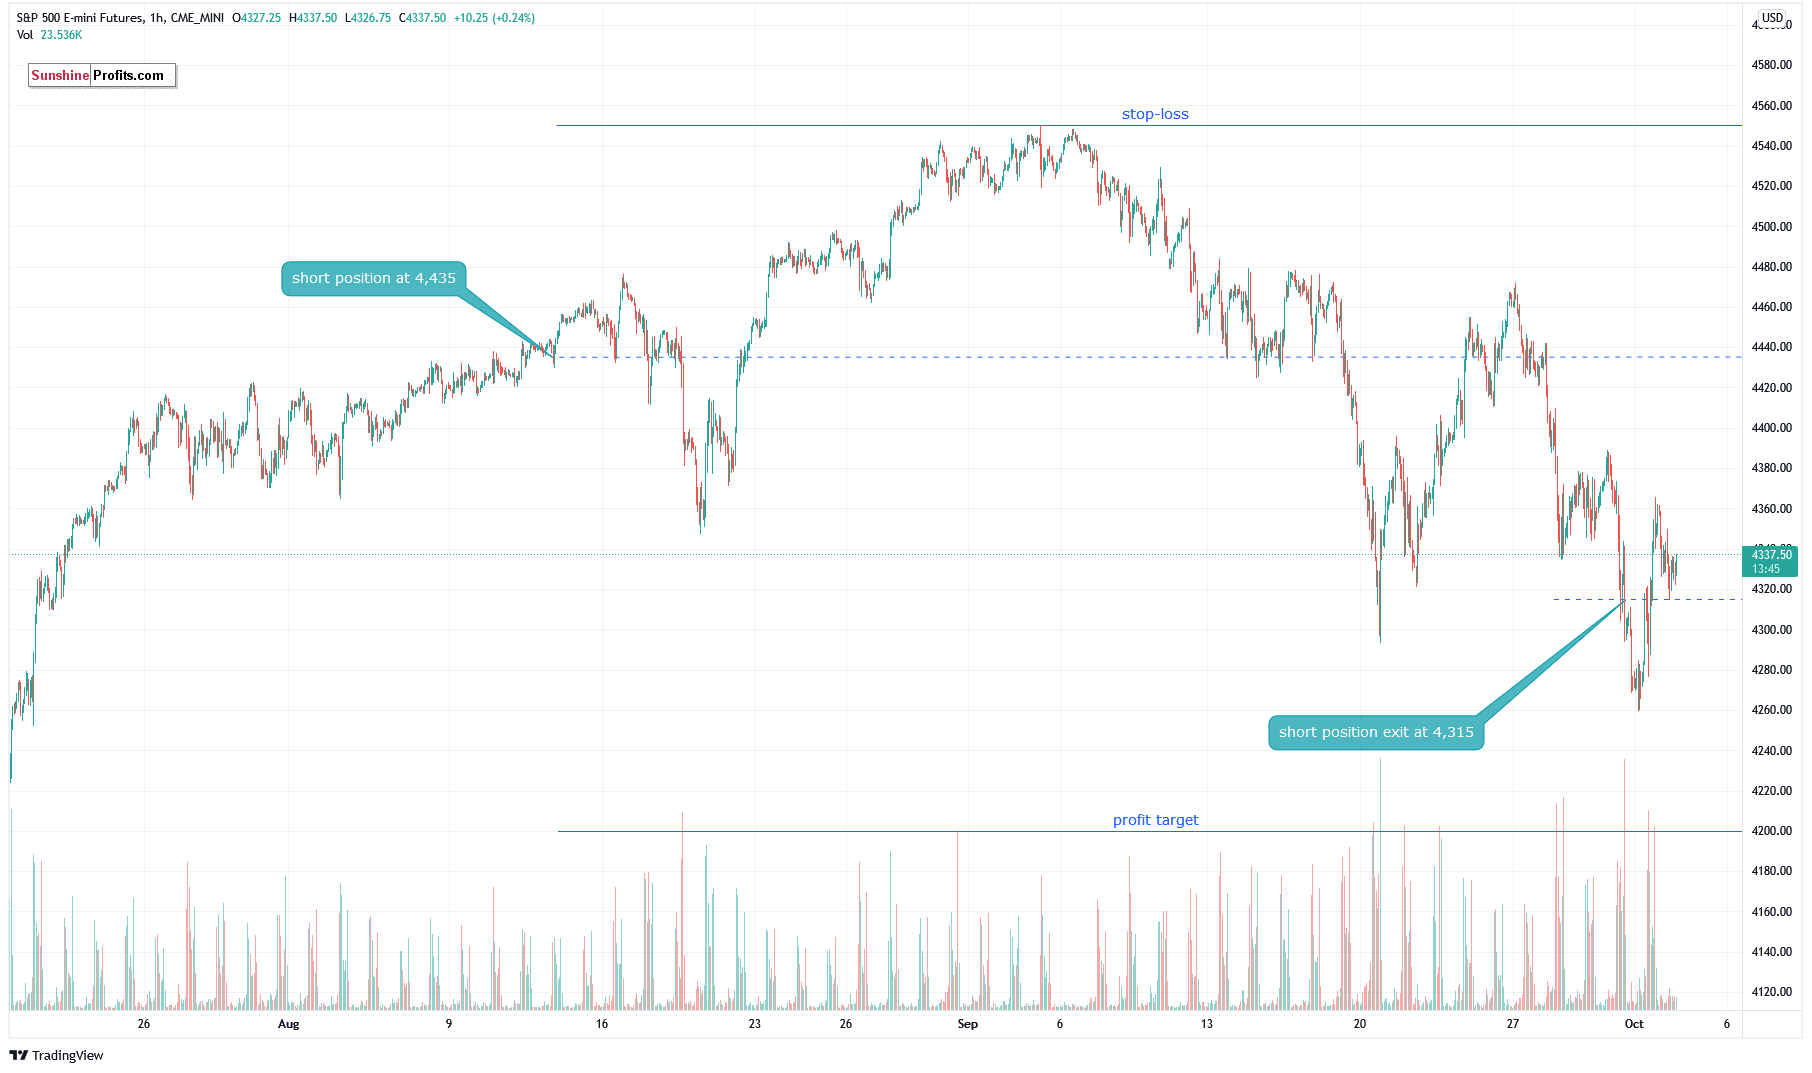
Let’s take a look at the hourly chart of the S&P 500 futures contract. We opened a short position on August 12 at the level of 4,435 and closed it on Friday at the level of 4,315 with a gain of 120 points because the risk/reward perspective seemed less favorable (chart by courtesy of http://tradingview.com):

Conclusion
Last week the broad stock market got back to its mid-September local low and the S&P 500 index fell briefly below 4,300 level. Then we’ve witnessed a short-covering rally. Most likely it was just an upward correction within a downtrend. There have been no confirmed positive signals so far. However, the risk/reward perspective seems less favorable right now and no positions are currently justified.
Here’s the breakdown:
- The S&P 500 bounced from 4,300 support level on Friday, but for now it looks like a short-term upward correction.
- Our speculative short position has been closed right before the opening of Friday’s cash market’s trading session.
- However, we are still expecting more downward pressure and a correction to 4,200-4,250 level.
Today's premium Stock Trading Alert includes details of our trading position. Interested in more exclusive updates? Join our premium Stock Trading Alerts newsletter and read all the details today.
Thank you.
Paul Rejczak,
Stock Trading Strategist
Sunshine Profits: Effective Investments through Diligence and Care -
S&P 500 Fell To Previous Low: When in Doubt Get Out!
October 1, 2021, 9:29 AMThe S&P 500 index fell very close to its recent local low yesterday. Will the market break below the 4,300 level? It may fluctuate for some time.
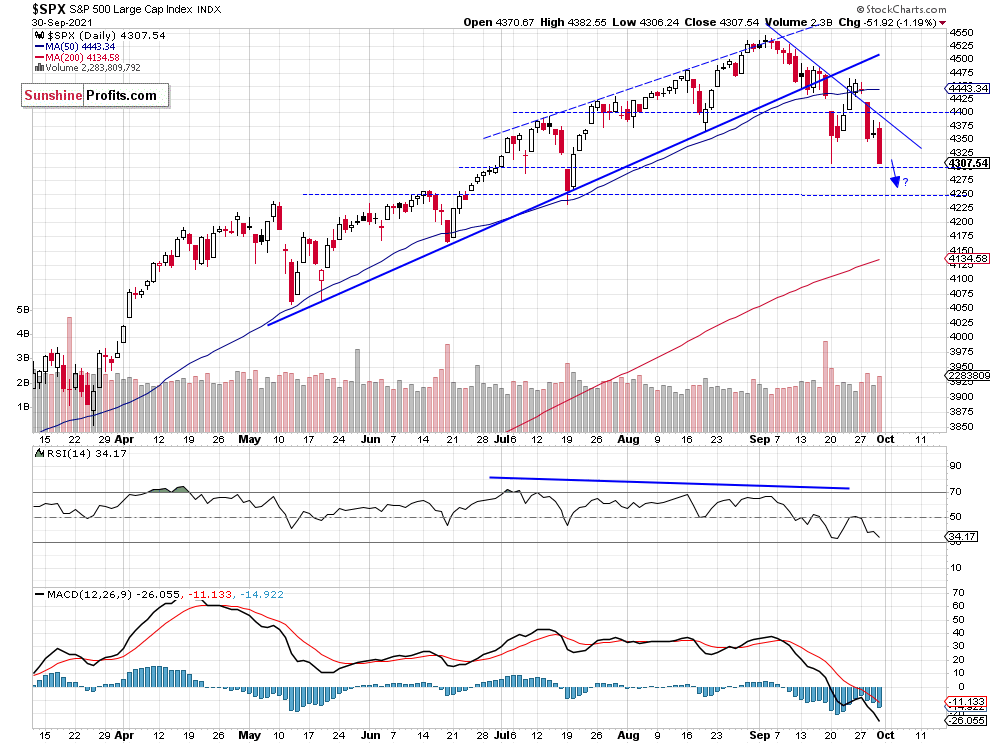
The S&P 500 index retraced almost all of its recent advance yesterday, as it extended its short-term downtrend. The index fell 1.2% vs. its Wednesday’s closing price and it got back closer to the 4,300 price level. In the previous week, the market fell the lowest since July 20, as it reached the local low of 4,305.91. The S&P 500 was 239.9 points or 5.28% below the September 2 record high of 4,545.85. And yesterday’s daily low was at 4,306.24. This morning the market is expected to open 0.3-0.4% higher and we may see a short-term consolidation.
The nearest important support level of the broad stock market index is now at 4,300, marked by the mentioned local low. The next support level is at around 4,250. On the other hand, the resistance level is at 4,445-4,455, marked by the recent local lows. The S&P 500 continues to trade below its month-long downward trend line, as we can see on the daily chart (chart by courtesy of http://stockcharts.com):

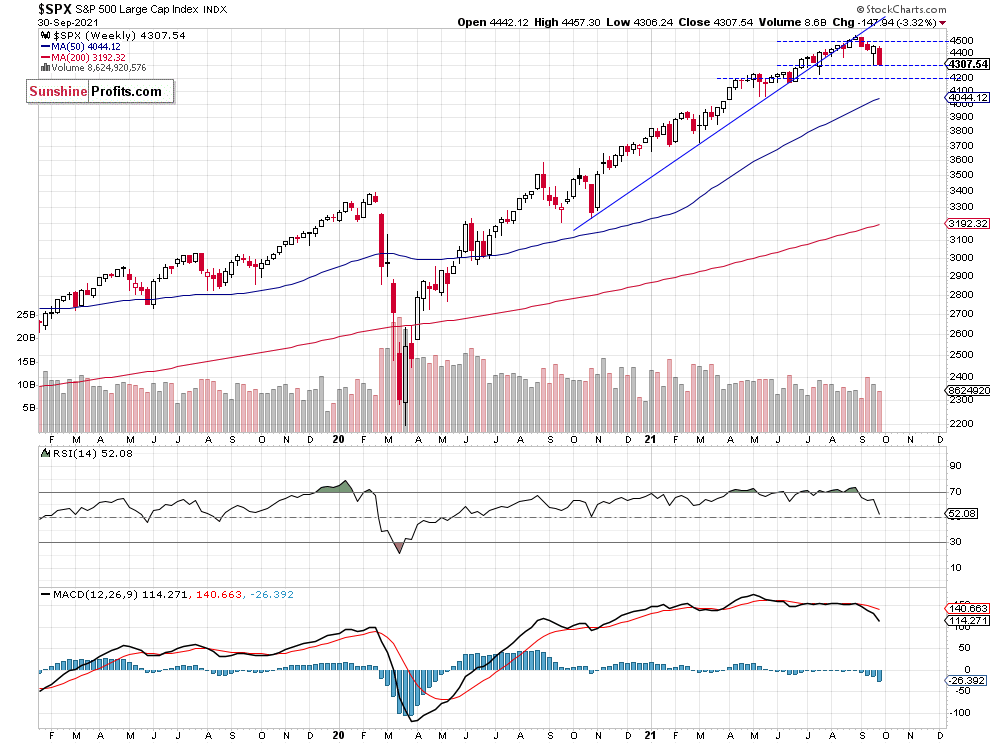
S&P 500 Below Medium-Term Upward Trend Line
The S&P 500 index is trading below its almost year-long upward trend line. The nearest important medium-term support level is at 4,200-4,300, as we can see on the weekly chart:

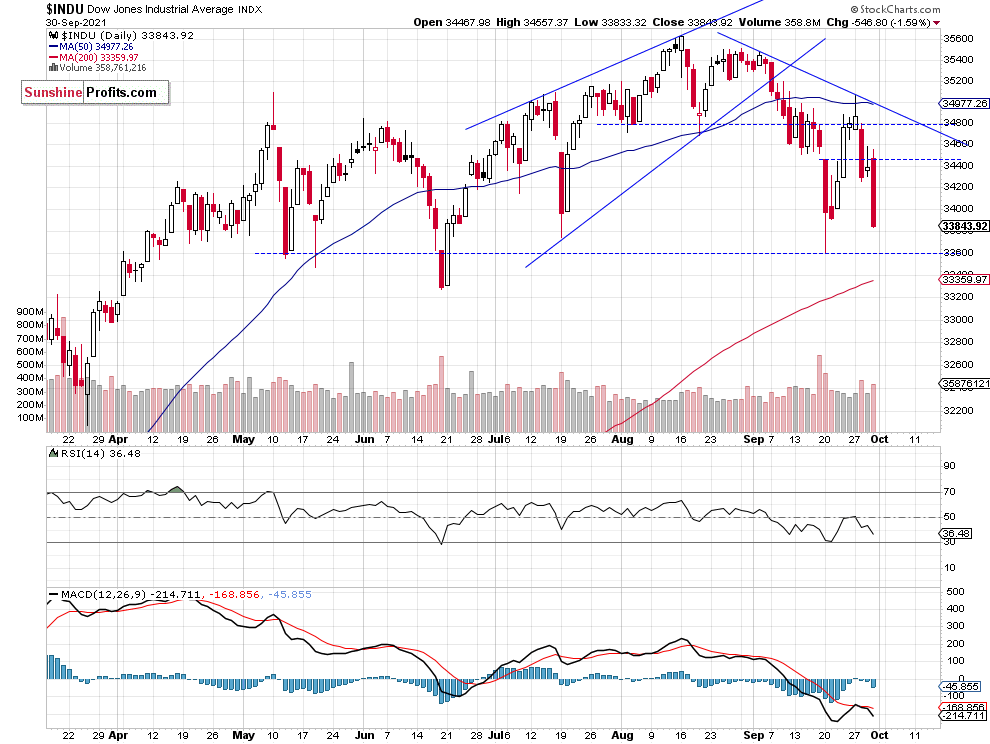
Dow Jones Is Also Closer to the Previous Local lows
Let’s take a look at the Dow Jones Industrial Average chart. In early September the blue-chip index broke below a two-month-long rising wedge downward reversal pattern. Last week it has bounced from the 33,600 price level up to around 35,000. But since Monday it has been declining towards the local low again, as we can see on the daily chart:

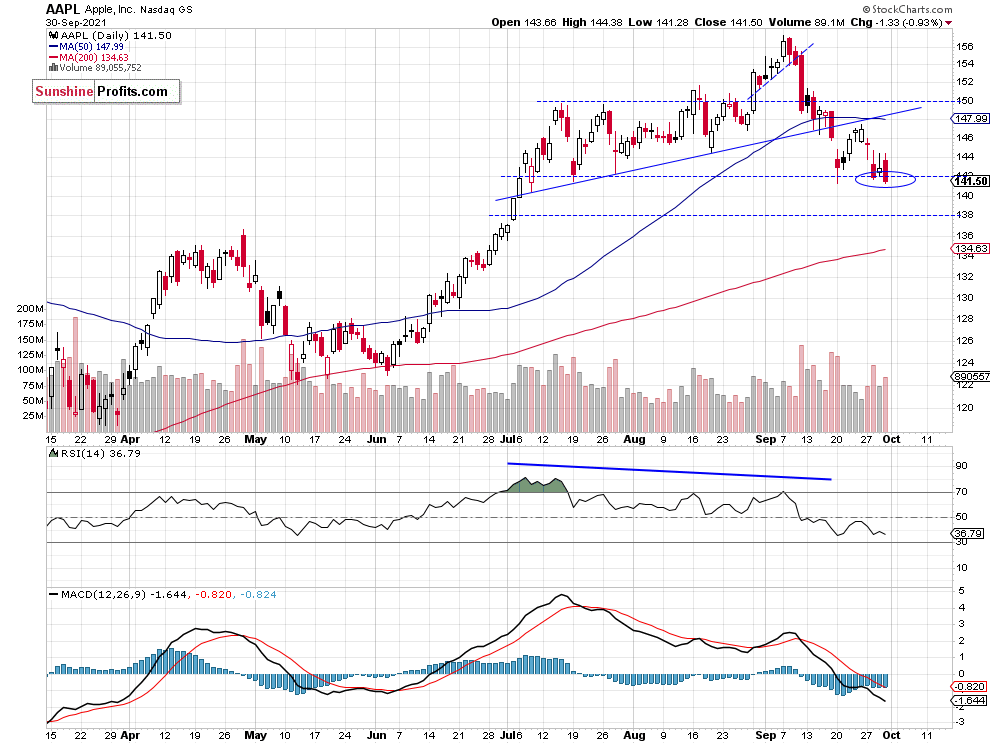
Apple Remains at Support Level
Apple stock weighs around 6.1% in the S&P 500 index, so it is important for the whole broad stock market picture. Since early September it has been declining from the record high. Recently the stock sold off to the previous local lows along $142 price level. It is acting as a support level, so it is still a “make or break” situation.

Conclusion
Since last Tuesday we’ve witnessed a short-covering rally fueled by the Wednesday’s FOMC Monetary Policy release. But it was just an upward correction within a downtrend and the S&P 500 index’ mid-September short-term consolidation acted as a short-term resistance level. The market fell close to its recent local low. We may see a short-term consolidation at that support level.
There have been no confirmed positive signals so far. However, the risk/reward perspective seems less favorable right now and no positions are currently justified.
Here’s the breakdown:
- The S&P 500 got back to its previous low yesterday and it may act as a short-term support level.
- Our speculative short position has been closed right before the opening of today’s cash market’s trading session.
- However, we are still expecting more downward pressure and a correction to 4,200-4,250 level.
Today's premium Stock Trading Alert includes details of our trading position. Interested in more exclusive updates? Join our premium Stock Trading Alerts newsletter and read all the details today.
Thank you.
Paul Rejczak,
Stock Trading Strategist
Sunshine Profits: Effective Investments through Diligence and Care -
Stocks Fluctuate Following Tuesday’s Sell-Off – Will They Break Down?
September 30, 2021, 9:09 AMAvailable to premium subscribers only.
-
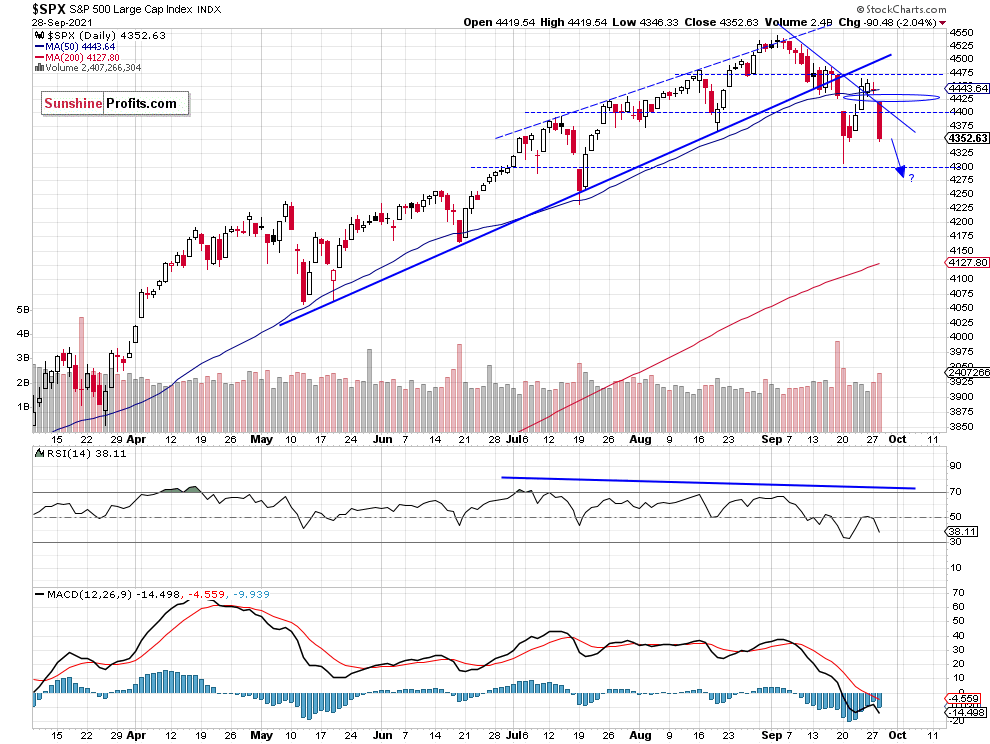
S&P 500 Index: Bearish Price Action Again
September 29, 2021, 9:31 AMStocks went lower yesterday following the failed attempt at extending their last week’s rebound. Is the market poised to break below the recent low?
The S&P 500 index retraced most of its recent advance on Tuesday, as it lost 2.04%. It followed the strengthening U.S. dollar and rising bond yields. One and a half week ago, it fell the lowest since July 20, as it reached the local low of 4,305.91. It was 239.9 points or 5.28% below the September 2 record high of 4,545.85. Then it has been bouncing and on Thursday it reached a local high of 4,465.40. So yesterday’s decline may look like resuming of the downtrend. However, this morning the market is expected to open slightly higher and we may see an intraday consolidation.
The nearest important support level of the broad stock market index is now at 4,440-4,450, marked by the recent local low. The next support level is at around 4,300. On the other hand, the resistance level is at 4,400 again. The S&P 500 got back below its month-long downward trend line, as we can see on the daily chart (chart by courtesy of http://stockcharts.com):

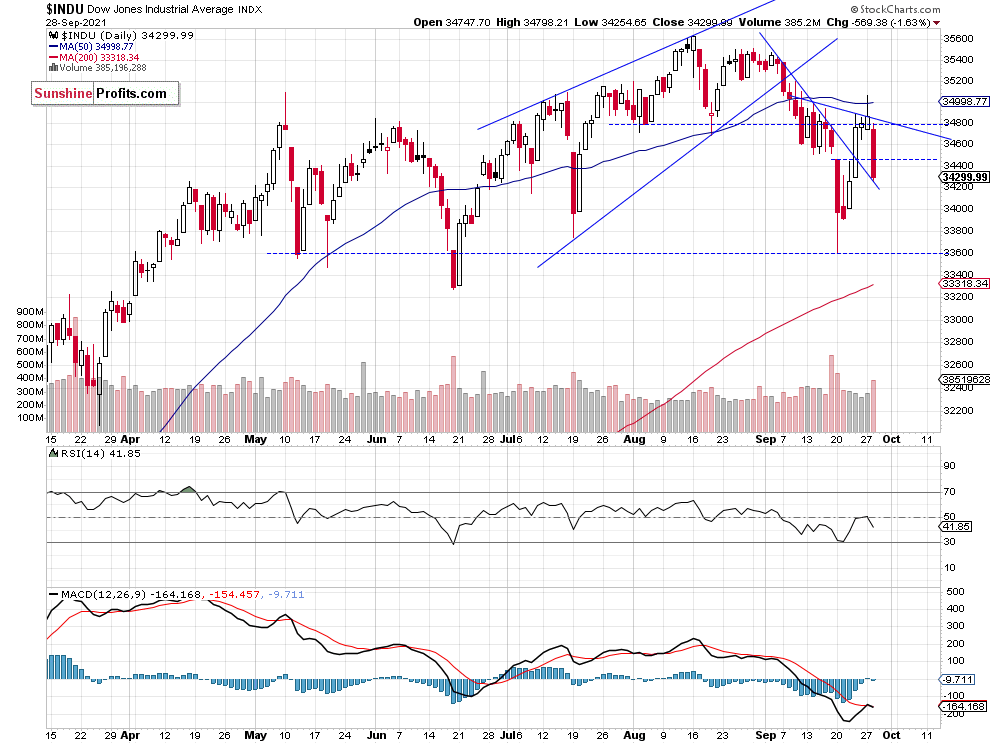
Dow Jones Failed to Break Above 35,000
Let’s take a look at the Dow Jones Industrial Average chart. In early September the blue-chip index broke below a two-month-long rising wedge downward reversal pattern. Last week it has bounced from the 33,600 price level up to around 35,000. But yesterday it got back below 34,500 level again, as we can see on the daily chart:

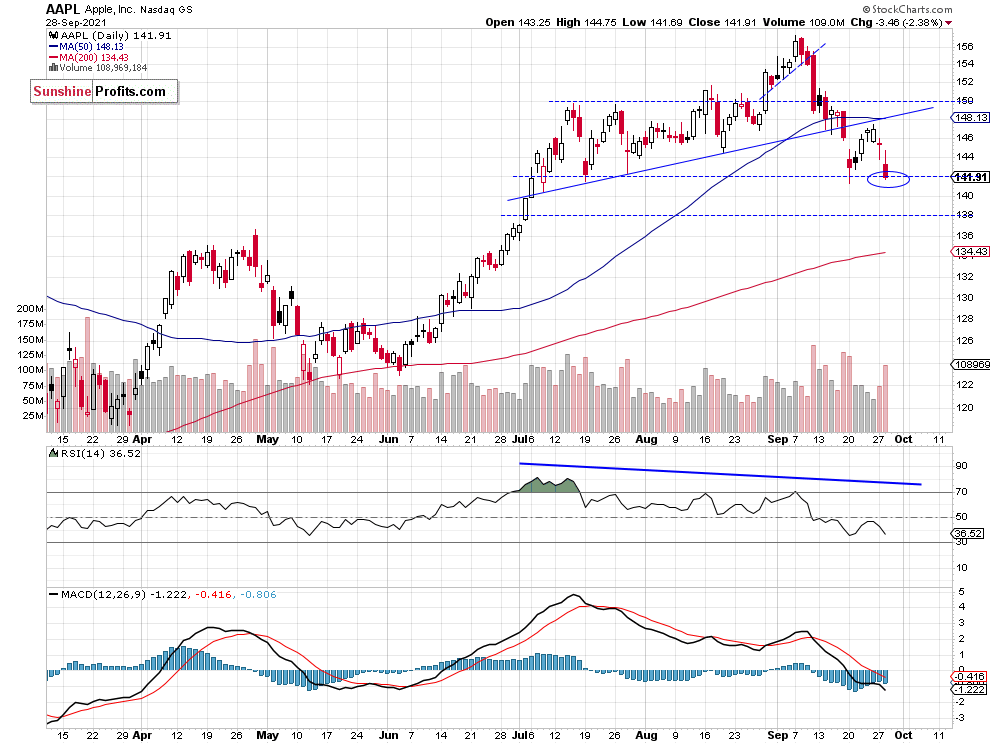
Apple Is Back at Lows
Apple stock weighs around 6.3% in the S&P 500 index, so it is important for the whole broad stock market picture. In early September it reached a new record high of $157.26. And since then it has been declining. So it looked like a bull trap trading action. On Monday a week ago the stock sold off to the previous local lows along $142 price level. It acted as a support level and the stock bounced to the broken upward trend line. Yesterday Apple led the broad stock market lower, as it fell 2.4%. Right now the price is sitting at the support level of its previous lows. So it is another “make or break” situation.

Conclusion
Since last Tuesday we’ve witnessed a short-covering rally fueled by the Wednesday’s FOMC Monetary Policy release. But it was just an upward correction within a downtrend and the S&P 500 index’ mid-September short-term consolidation acted as a short-term resistance level.
There have been no confirmed positive signals so far. Therefore, we think that the short position is justified from the risk/reward perspective.
Here’s the breakdown:
- The S&P 500 accelerated its downtrend a week ago, as it got close to 4,300 level. It retraced some of the decline last week, but yesterday’s price action was very bearish again.
- Our speculative short position is still justified from the risk/reward perspective.
- We are expecting more downward pressure and a correction to 4,200-4,250 level.
Today's premium Stock Trading Alert includes details of our trading position. Interested in more exclusive updates? Join our premium Stock Trading Alerts newsletter and read all the details today.
Thank you.
Paul Rejczak,
Stock Trading Strategist
Sunshine Profits: Effective Investments through Diligence and Care -
Stocks Turning Lower Again, End of Upward Correction?
September 28, 2021, 8:45 AMAvailable to premium subscribers only.
Free Gold &
Stock Market Newsletter
with details not available
to 99% investors
+ 7 days of Gold Alerts
Gold Alerts
More-
Status
New 2024 Lows in Miners, New Highs in The USD Index
January 17, 2024, 12:19 PM -
Status
Soaring USD is SO Unsurprising – And SO Full of Implications
January 16, 2024, 8:40 AM -
Status
Rare Opportunity in Rare Earth Minerals?
January 15, 2024, 2:06 PM

