

-
S&P 500’s Consolidation – Most Likely a Short-Term Topping Pattern
October 11, 2021, 9:08 AMAvailable to premium subscribers only.
-
Stocks’ Breakout May Be Short-Lived, NFP Release Leaves Question Marks.
October 8, 2021, 9:25 AMStocks broke above their consolidation yesterday. Is this an upward reversal or just another upward correction? The NFP release leaves question marks.
The S&P 500 index gained 0.83% on Thursday following breaking above the recent local highs and the 4,400 price level. The market retraced most of its late September’s decline yesterday as investors awaited today’s monthly jobs data release, among other factors. The Nonfarm Payrolls release has been worse than expected at +194,000. However, the main indices are expected to open 0.1-0.5% higher this morning.
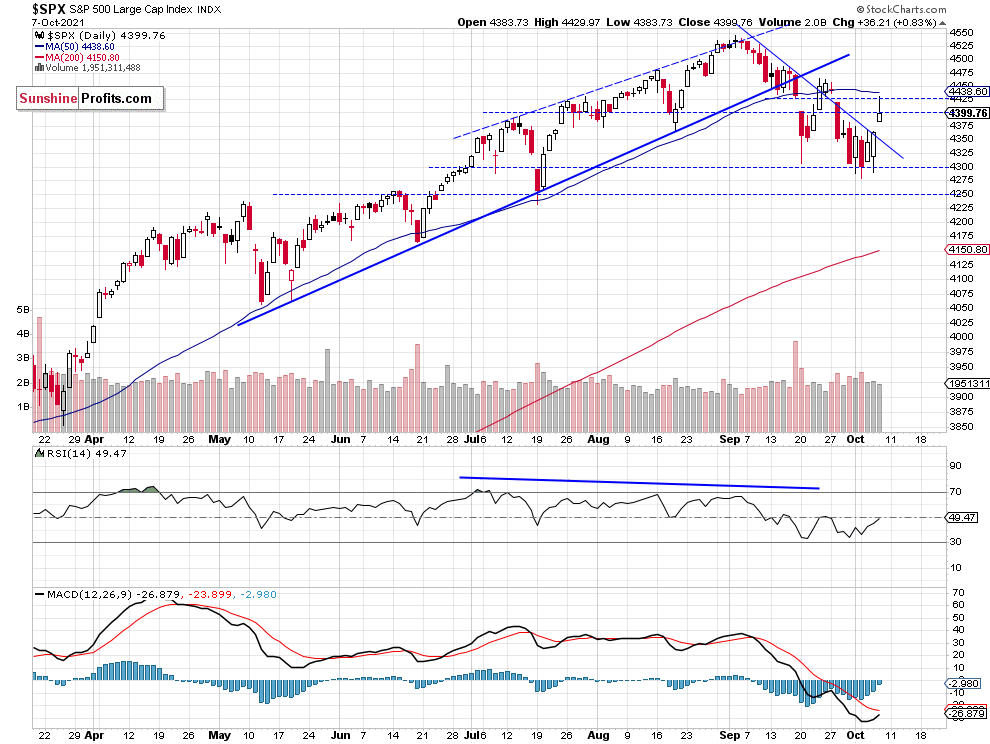
The support level is now at 4,365-4,385, marked by yesterday’s daily gap up of 4,365.57-4,383.73. On the other hand, the resistance level is at 4,430-4,450. The S&P 500 broke above its month-long downward trend line, as we can see on the daily chart (chart by courtesy of http://stockcharts.com):

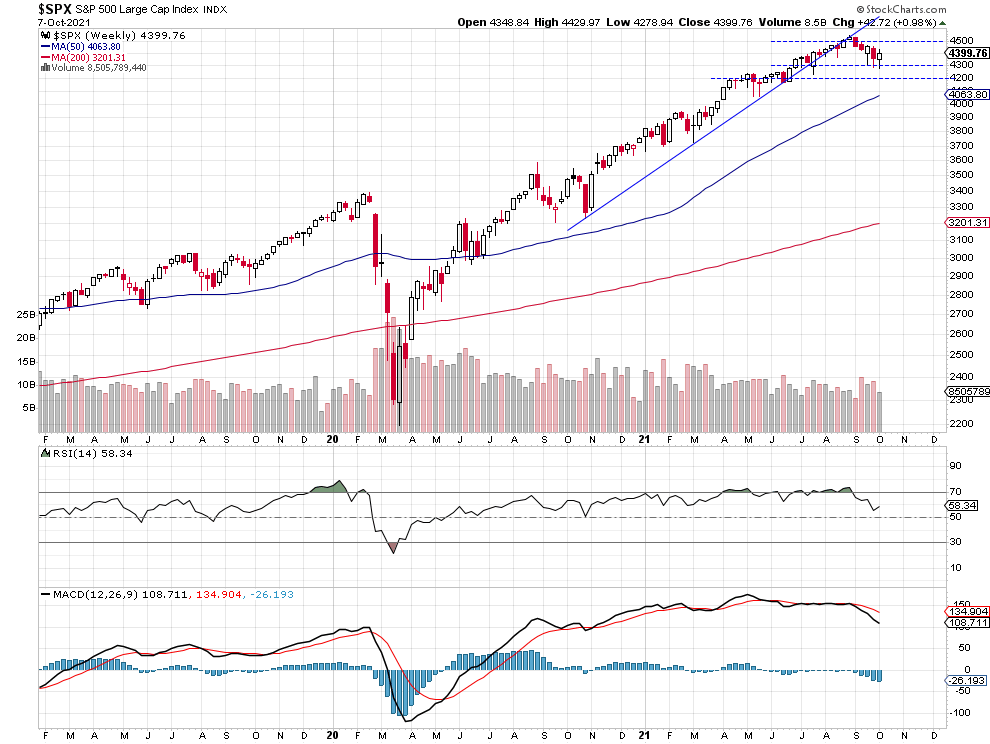
S&P 500 Remains Above Medium-Term Support Level
The S&P 500 index is trading below its almost year-long upward trend line. The nearest important medium-term support level remains at 4,200-4,300, as we can see on the weekly chart:

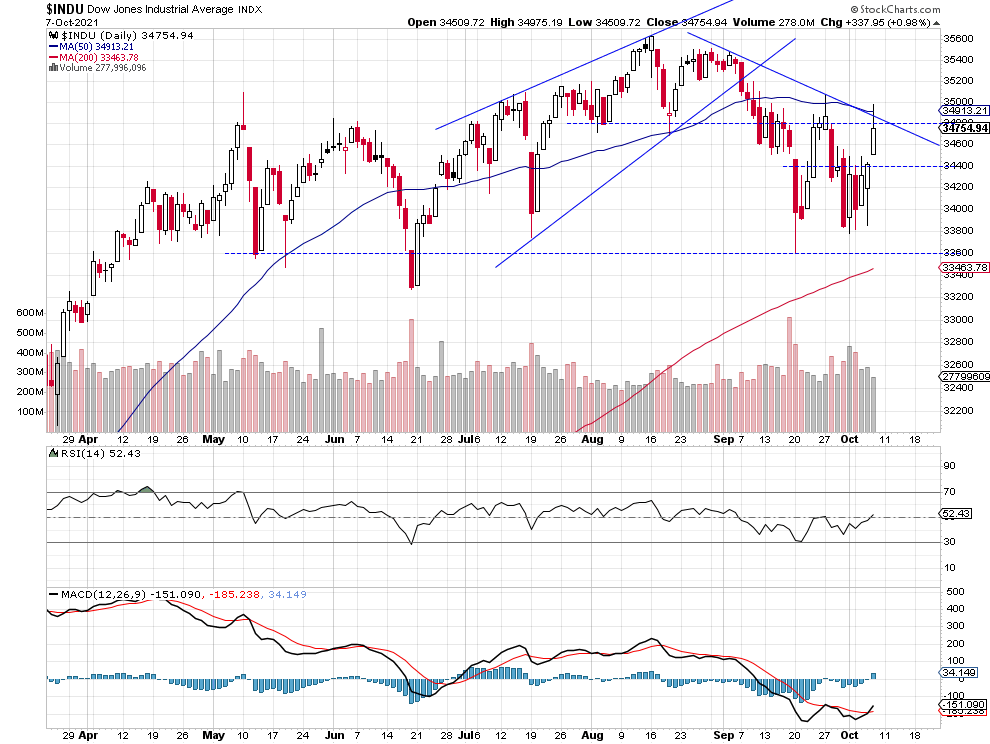
Dow Jones Got Back to Its Downward Trend Line
Let’s take a look at the Dow Jones Industrial Average chart. The blue-chip index also broke above its short-term consolidation yesterday. However, it remained below a month-long downward trend line. The nearest important resistance level is at 35,000, as we can see on the daily chart:
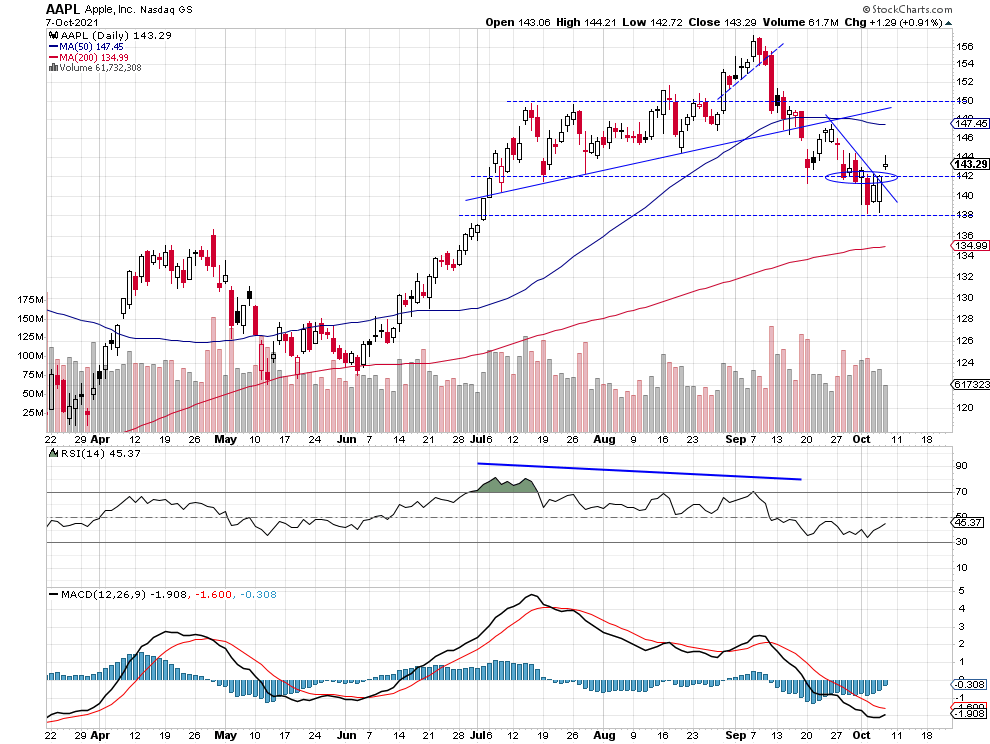
Apple Is Back Above $142 Price Level Again
Apple stock weighs around 6.1% in the S&P 500 index, so it is important for the whole broad stock market picture. The stock broke above $142 price level yesterday but for now it looks like a correction within a downtrend or a consolidation following the September’s decline. The resistance level is now at $144, marked by the previous local highs.

Conclusion
The S&P 500 index has been trading within a short-term consolidation since last Thursday. Yesterday the index broke above that consolidation and it got back above the 4,400 level. For now it looks like an upward correction following the late September’s declines.
The risk/reward perspective seems less favorable right now and no positions are currently justified.
Here’s the breakdown:
- The S&P 500 broke above its week-long consolidation, but bulls are not out of the woods yet, as the worse-than-expected jobs data release may lead to some more uncertainty.
- Our speculative short position has been closed last Friday at a much lower level.
- We are still expecting more downward pressure and a correction to 4,200-4,250 level.
Today's premium Stock Trading Alert includes details of our trading position. Interested in more exclusive updates? Join our premium Stock Trading Alerts newsletter and read all the details today.
Thank you.
Paul Rejczak,
Stock Trading Strategist
Sunshine Profits: Effective Investments through Diligence and Care -
S&P 500 About to Move Higher, but Is This a Reversal?
October 7, 2021, 9:31 AMAvailable to premium subscribers only.
-
Stocks Extend Their Consolidation Ahead of Friday’s NFP Data
October 6, 2021, 9:29 AMStocks extended their consolidation yesterday as the index gained over 1%. But today it is expected to open lower again. Is this a bottoming pattern?
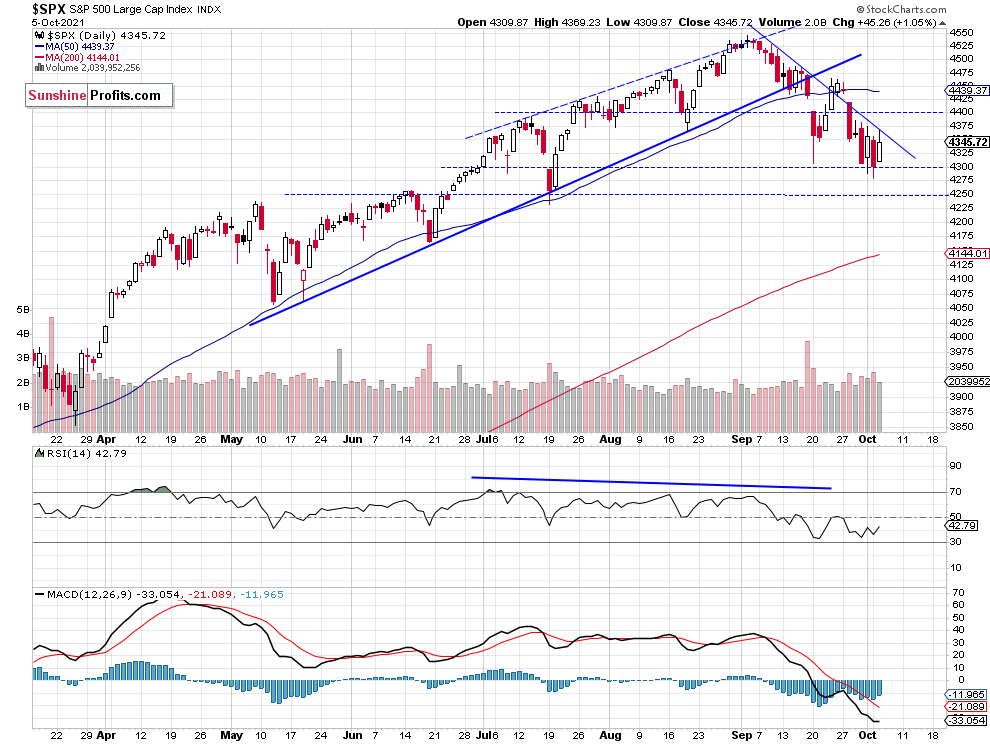
The S&P 500 index gained 1.05% on Tuesday, as it bounced from the 4,300 level again. For now, it looks like a consolidation following a month-long decline. The market will be waiting for Friday’s Nonfarm Payrolls number release and the coming quarterly corporate earnings season. Today’s ADP Non-Farm Employment Change release has been better than expected at +568,000, but it only brought more uncertainty ahead of the Friday’s data. And we will likely see some further short-term fluctuations. The main indices are expected to open around 0.8% lower this morning.
The support level remains at 4,290-4,300. On the other hand, the resistance level is at 4,375-4,400, marked by the recent local highs. The S&P 500 continues to trade below its month-long downward trend line, as we can see on the daily chart (chart by courtesy of http://stockcharts.com):

Dow Jones Is Also Going Sideways
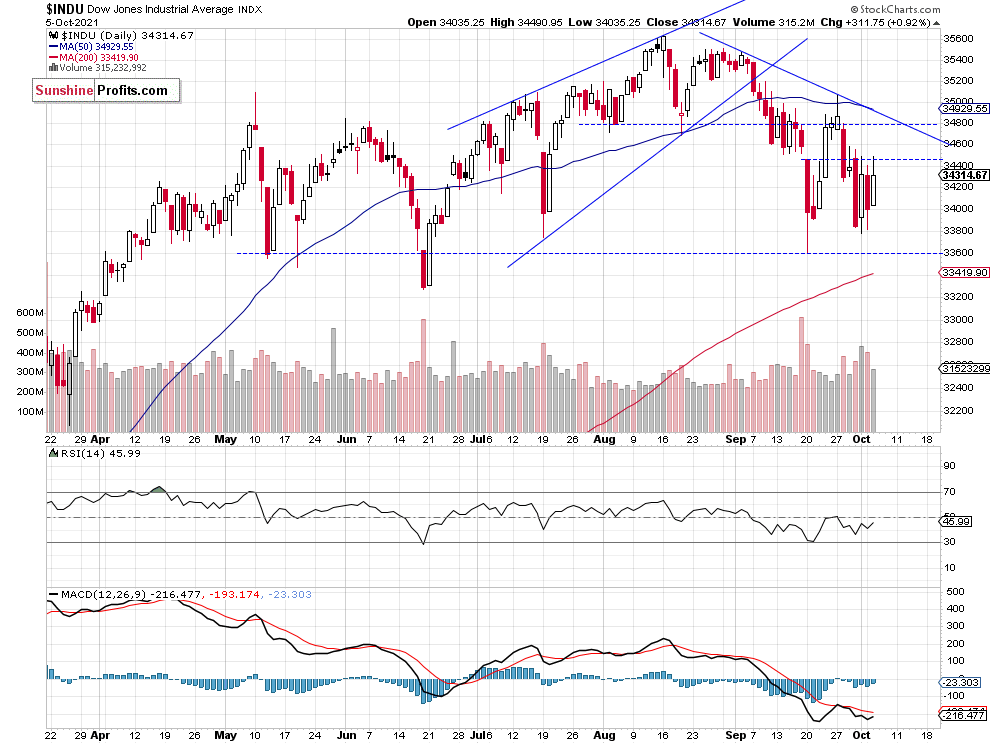
Let’s take a look at the Dow Jones Industrial Average chart. In early September the blue-chip index broke below a two-month-long rising wedge downward reversal pattern. Last week it got back closer to the mid-September local low. However, unlike the broad stock market’s gauge, it managed to stay above that support level. The nearest important resistance level remains at around 34,500, as we can see on the daily chart:

Apple Broke Below Its Support Level
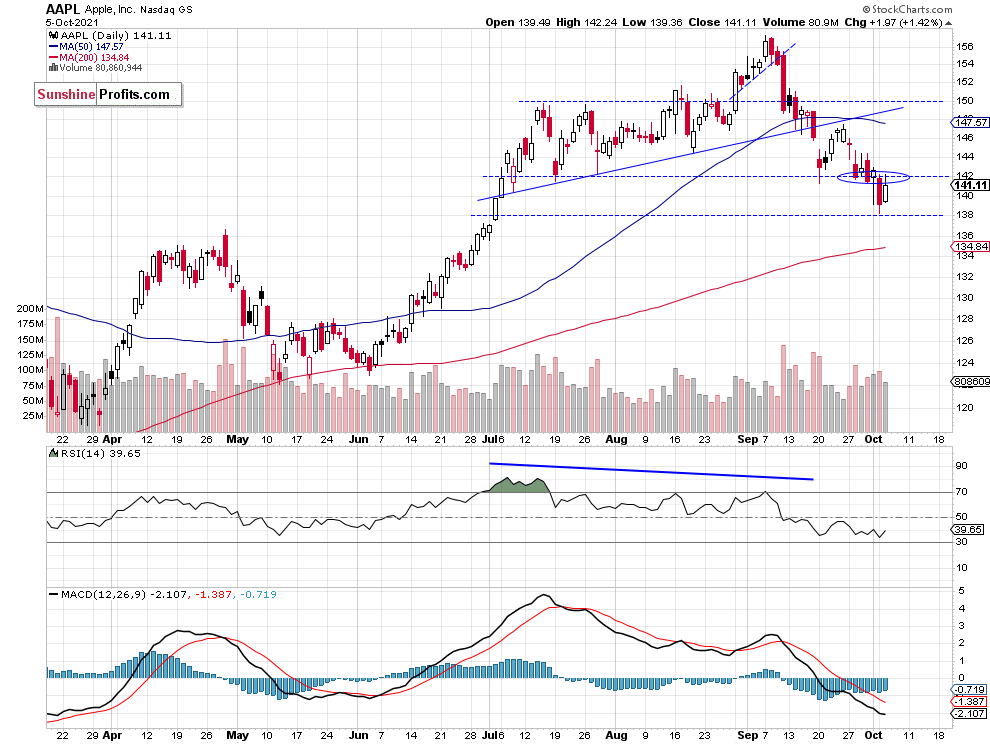
Apple stock weighs around 6.1% in the S&P 500 index, so it is important for the whole broad stock market picture. Since early September it has been declining from the record high. Recently the stock broke below the support level of around $142, marked by the previous local lows. The $142 price level is acting as a resistance level right now.

Conclusion
The S&P 500 index has been trading within a short-term consolidation since last Thursday. On Monday the broad stock market retraced its Friday’s advance and the S&P 500 index fell to the 4,300 level again but yesterday it came back higher. There have been no confirmed positive signals so far. However, the risk/reward perspective seems less favorable right now and no positions are currently justified.
Here’s the breakdown:
- The S&P 500 trades within a short-term consolidation that looks like a flat correction within a month-long downtrend.
- Our speculative short position has been closed right before the opening of Friday’s cash market’s trading session.
- However, we are still expecting more downward pressure and a correction to 4,200-4,250 level.
Today's premium Stock Trading Alert includes details of our trading position. Interested in more exclusive updates? Join our premium Stock Trading Alerts newsletter and read all the details today.
Thank you.
Paul Rejczak,
Stock Trading Strategist
Sunshine Profits: Effective Investments through Diligence and Care -
S&P 500’s Consolidation, Has the Market Bottomed?
October 5, 2021, 9:24 AMAvailable to premium subscribers only.

Free Gold &
Stock Market Newsletter
with details not available
to 99% investors
+ 7 days of Gold Alerts
Gold Alerts
More-
Status
New 2024 Lows in Miners, New Highs in The USD Index
January 17, 2024, 12:19 PM -
Status
Soaring USD is SO Unsurprising – And SO Full of Implications
January 16, 2024, 8:40 AM -
Status
Rare Opportunity in Rare Earth Minerals?
January 15, 2024, 2:06 PM

