

-
Those Tax Hikes I Warned About...
April 23, 2021, 9:26 AMRemember how every month in 2021 started off hot and then saw a pullback and volatility occur by the second half of the month? Welcome to the second half of April.
After switching my calls on the SPDR S&P ETF (SPY) and the SPDR Dow Jones ETF (DIA) a week ago (Apr. 16), both have declined over 1% and are on track for their first losing weeks in more than a month.
Despite the month’s promising start with blowout jobs reports, stronger-than-expected earnings, the lowest jobless claims in months, and more, remember how I said to stay vigilant on inflation and potential tax hikes?
Well, the market on Thursday (Apr. 22) tanked thanks to rumblings that President Biden could hike the capital gains tax rate for those earning over $1 million. This isn’t just some ordinary tax hike either. Biden would essentially double the current tax rate of 20% to 39.6% for those wealthy investors and hike it as high as 43.4% for the richest of the rich.
Not to mention President Biden has been talking for weeks about hiking corporate taxes to 28%.
Tax the rich? Guess Mr. President has to fund his spending sprees somehow, no?
Although April historically has been the strongest month for stocks over the past 20 years, with the S&P 500 witnessing gains in 14 of the past 15 years, not everything is smooth sailing right now. Especially if you’re a SPAC or a speculative sector.
In fact, for the broader market, I’d even caution that we may be at or around a peak, with most of the good news priced in already. Despite what’s been a rough week, the Dow and S&P are still at historically high levels. According to Binky Chadha, Deutsche Bank’s chief U.S. equity strategist, we could see a significant pullback between 6% and 10% over the next three months because of potentially full valuations and inflation fears.
My goal for these updates is to educate you, give you ideas, and help you manage money like I did when pressing the buy and sell buttons for $600+ million in assets. I left that career to pursue one to help people who needed help instead of the ultra-high net worth.
With that said, to sum it up:
We could see more volatility and more muted gains than what we’ve come to know over the last year.
April is historically strong, but please monitor overvaluation, inflation, bond yields, and potential tax hikes. Be optimistic but realistic. A decline above ~20%, leading to a bear market, appears unlikely. Yet, we could eventually see a minor pullback by the summer, as Deutsche Bank said.
Hopefully, you find my insights enlightening. I welcome your thoughts and questions and wish you the best of luck.
Is the S&P Still Too Frothy?

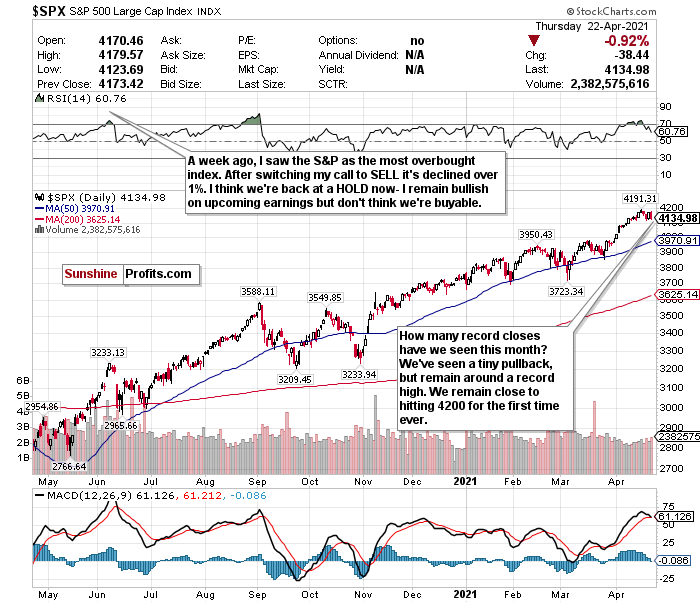
Figure 1- S&P 500 Large Cap Index $SPX
On the one hand, according to Sanford C. Bernstein strategists, the S&P 500 index could double by the end of the decade and reach 8,000.
Historically, we could really be at a strong entry point for the long-term too. Over two weeks ago, we marked the first anniversary of this bull market. Historically, S&P 500 bull markets since 1957 on average resulted in price gains of 179% and lasted an average of 5.8 years.
Because the S&P 500 has risen just about 84.81% since March 23, 2020, if history tells us anything, we may just be getting started.
Furthermore, earnings season is off to a roaring start, with companies crushing estimates. There’s no reason to believe this will end either. Not to mention, it’s April, historically the strongest month for stocks.
On the other hand, despite this week’s minor pullback, the S&P 500 continues to hover around record highs as it approaches 4200 for the first time in its history. It’s also potentially historically overvalued. I’m more worried about valuations than I am excited about earnings.
Also, I’m not pleased about potential tax hikes for this frothy market.
I don’t see this as a buyable index at the moment. While it’s not quite as frothy as it was a week ago and more of a HOLD as of April 23, 2021, if it pops anymore, it could be more sellable. I’d prefer a deeper pullback.
HOLD. The S&P has skyrocketed to unprecedented levels and valuations, but strong earnings could give the index some momentum. For an ETF that attempts to directly correlate with the performance of the S&P 500, the S&P 500 SPDR ETF (SPY) is a great option.
For more of my thoughts on the market, such as tech, inflation fears, and why I love emerging market opportunities, sign up for my premium analysis today.
Thank you for reading today’s free analysis. If you would like to receive daily premium follow-ups, I encourage you to sign up for my Stock Trading Alerts to also benefit from the trading action described - the moment it happens. The full analysis includes more details about current positions and levels to watch before deciding to open any new ones or where to close existing ones.
Thank you.
Matthew Levy, CFA
Stock Trading Strategist -
Earnings Season’s Hot Start
April 16, 2021, 9:13 AM“Other than my Cincinnati Bengals breaking my heart, few things are more consistent than stocks higher in April.”
As a stock nerd and NFL fan, I love this quote from Ryan Detrick, the chief market strategist at LPL Financial.
Historically in April, the S&P 500 has seen gains in 14 of the past 15 years. April has also been the strongest month for stocks over the past 20 years.
April 2021 has been no exception. Although March, and Q1, for that matter, ended with more questions than answers, this month has been nothing but white-hot.
The month kicked off with a blowout jobs report. It then continued with two consecutive weeks of jobless claims crushing estimates, retail sales coming in almost ⅓ higher than projected, and bank earnings blowing past forecasts. The Dow Jones and S&P 500 seemingly hit fresh record-highs every other day, and despite complications with JnJ’s one-dose vaccine, all signs point towards our life returning to normal by this summer.
While optimism is high right now, I implore you to remain cautious. I’m really not sure how much higher the Dow and S&P can go without pulling back somewhat. Not to mention, it still has not been smooth sailing for Cathie Wood stocks or SPACs for the last two months either. This rotation into recovery names is very real.
Remember that every month in 2021 thus far has started off hot and saw a pullback and volatility occur by the second half of the month.
We are now officially in the latter half of April. Although, as I said, April is historically a strong performing month, think about this. By the second half of January, we had Reddit trades spooking investors. In February and March, we had surging bond yields, inflation fears, or Jay Powell comments that rubbed people the wrong way. These concerns won’t just disappear because we want them to. If we could make things magically disappear, COVID would’ve been over yesterday.
According to Binky Chadha, Deutsche Bank’s chief U.S. equity strategist, we could see a significant pullback between 6% and 10% over the next three months because of potentially full valuations and inflation fears. Even if this $2 trillion infrastructure plan doesn’t pass in full, do we really need to spend any more trillions with an economy starting to turn red hot?
Plus, how do you think this will be paid for? Hiking taxes- namely corporate taxes. Those gains that high growth stocks saw after Trump cut corporate taxes in 2017 could very well go away. While President Biden has indicated a willingness to negotiate his 28% corporate tax proposal, it’s still a tax hike.
My goal for these updates is to educate you, give you ideas, and help you manage money like I did when I was pressing the buy and sell buttons for $600+ million in assets. I left that career to pursue one to help people who needed help instead of the ultra-high net worth.
With that said, to sum it up:
We’re hot right now.
However, we could see more volatility and more muted gains than what we’ve come to know over the last year.
April is historically strong, but please monitor overvaluation, inflation, bond yields, and potential tax hikes. Be optimistic but realistic. A decline above ~20%, leading to a bear market, appears unlikely. Yet, we could eventually see a minor pullback by the summer, as Deutsche Bank said.
Hopefully, you find my insights enlightening. I welcome your thoughts and questions and wish you the best of luck.
The Dow Jones- How Much Higher Could We Go?

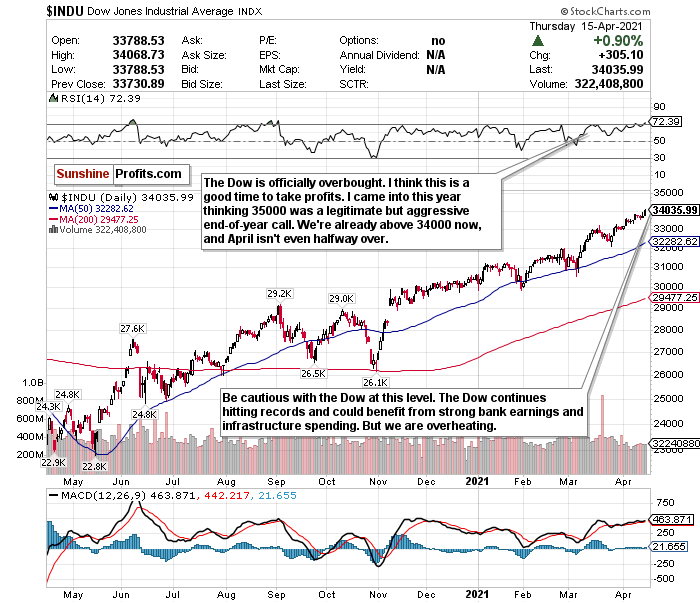
Figure 1- Dow Jones Industrial Average $INDU
The Dow Jones remains red hot in 2021. Strong bank earnings, a recovering economy, and the potential for further infrastructure spending have sent the index to record highs in what seems to be every other day. Unfortunately, we are nowhere close to buyable any longer and are firmly overbought with an RSI over 72.
For the longest time, I’ve said to HOLD the Dow and let the gains ride. Now, I think it’s an excellent time to trim and take profits. Many analysts believe the index could end the year at 35,000 or higher, and the wheels are still in motion for that to happen. The problem, though? We’re above 34,000, and we’re only in mid-April.
You could do a heck of a lot better for a buyable entry point.
Having Dow exposure is valuable. The index has many strong recovery cyclical plays that should benefit from what appears to be an economic recovery and reopening going even better than expected. The Dow could also be quite beneficial as a hedge against volatile growth stocks and SPACs. You won’t see bond yields spooking this index as much.
But at this level, it’s probably better to SELL and consider trimming profits.
For an ETF that aims to correlate with the Dow’s performance, the SPDR Dow Jones ETF (DIA) is a great option.
For more of my thoughts on the market, such as tech, inflation fears, and why I love emerging market opportunities, sign up for my premium analysis today.
Thank you for reading today’s free analysis. If you would like to receive daily premium follow-ups, I encourage you to sign up for my Stock Trading Alerts to also benefit from the trading action described - the moment it happens. The full analysis includes more details about current positions and levels to watch before deciding to open any new ones or where to close existing ones.
Thank you.
Matthew Levy, CFA
Stock Trading Strategist -
Stocks are Heating Up
April 9, 2021, 9:09 AMIn keeping with its historical performance, April has started off white-hot. We ended March, and Q1 for that matter, with more questions than answers.
But April 2021 started with a blowout jobs report, and the indices haven't looked back since. Right now, the S&P 500 is at yet another record, the Dow is just about at a record, and we've seen a furious comeback for Big Tech and growth stocks.
The sentiment is certainly better now than it was just a couple of weeks ago. However, I implore you to remember that every month in 2021 thus far has started off hot and saw a pullback/volatility occur in the second half of the month.
Think about it. In January, we had the GameStop trade spooking investors. In February and March, we had surging bond yields, inflation fears, or Jay Powell comments that rubbed people the wrong way. These concerns won't just disappear because we want them to. If we could make things magically disappear, COVID would've been over yesterday.
But, as I mentioned before, April historically is a strong month for stocks. According to Ryan Detrick, chief market strategist at LPL Financial, "Other than my Cincinnati Bengals breaking my heart, few things are more consistent than stocks higher in April."
During April, the S&P 500 has gained in 14 of the past 15 years. April has also been the strongest month for stocks over the past 20 years.
The market concerns, though, are still intact. We still have to worry about inflation, bond yields, and stocks peaking. According to Binky Chadha, Deutsche Bank's chief U.S. equity strategist, we could see a significant pullback between 6% and 10% over the next three months.
Another thing I'm a bit concerned about is the $2 trillion infrastructure plan. While this is great for America's crumbling infrastructure, do we really need to spend any more trillions?
Plus, how do you think this will be paid for? Hiking taxes- namely corporate taxes. Those gains that high growth stocks saw after Trump cut corporate taxes in 2017 could very well go away. While President Biden has indicated a willingness to negotiate his 28% corporate tax proposal, it's still a tax hike.
My goal for these updates is to educate you, give you ideas, and help you manage money like I did when I was pressing the buy and sell buttons for $600+ million in assets. I left that career to pursue one to help people who needed help instead of the ultra-high net worth.
With that said, to sum it up:
We're hot right now.
However, we could see more volatility and more muted gains than what we've come to know over the last year.
April is historically strong, but please continue to monitor inflation, yields, and potential tax hikes. Be optimistic but realistic. A decline above ~20%, leading to a bear market, appears unlikely. Yet, we could eventually see a minor pullback by the summer, as Deutsche Bank said.
Hopefully, you find my insights enlightening. I welcome your thoughts and questions and wish you the best of luck.
Russell 2000- Still Buyable?

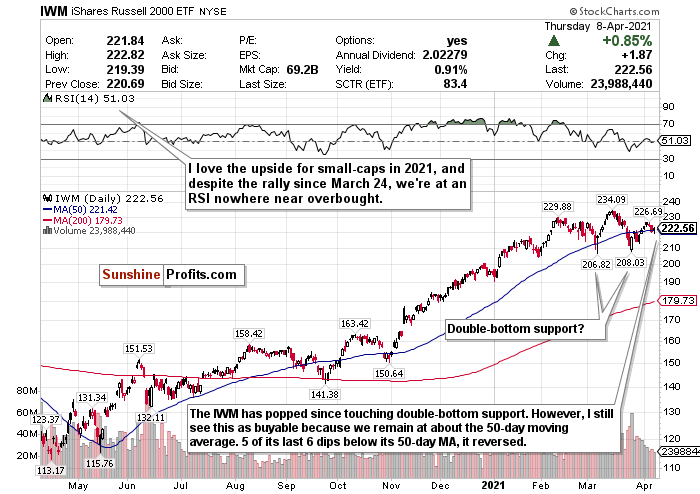
Figure 1- iShares Russell 2000 ETF (IWM)
I proudly switched my call on the iShares Russell 2000 ETF (IWM) to a BUY on March 24. I kicked myself for not calling BUY on the Russell after seeing a minor downturn during the second half of February and swore I wouldn’t make that mistake again.
We’re up to over 5% since then.
The climate right now supports the Russell 2000. The current economic policy is tailor-made for small-caps. The best part, though? The Russell is still very buyable.
The RSI is still hovering around 50. I also checked out the chart and noticed that almost every time the IWM touched or minorly declined below its 50-day moving average, it reversed.
Excluding the recovery in April from last year’s crash, 5 out of the previous 6 times the Russell did this with its 50-day, it saw a sharp reversal. The only time it didn’t was in October 2020, when the distance between its 50-day and its 200-day moving average was a lot more narrow.
Fast forward to now. The Russell 2000, despite its gains since tanking on March 23, remains right at about its 50-day moving average.
Aggressive stimulus, friendly policies, and a reopening world bode well for small-caps in 2021. I think this is something you have to consider for the Russell 2000 and maybe overpay for.
According to the chart, we may have found double-bottom support too.
Based on the chart and macro-level tailwinds, I feel that you can still BUY this index. In fact, it may be the most buyable of them all.
For more of my thoughts on the market, such as tech, inflation fears, and why I love emerging market opportunities, sign up for my premium analysis today.
Thank you for reading today’s free analysis. If you would like to receive daily premium follow-ups, I encourage you to sign up for my Stock Trading Alerts to also benefit from the trading action described - the moment it happens. The full analysis includes more details about current positions and levels to watch before deciding to open any new ones or where to close existing ones.
Thank you.
Matthew Levy, CFA
Stock Trading Strategist -
STOCK TRADING ALERT – AUTHOR’S UPDATE
April 5, 2021, 2:35 PMDear Readers,
Please be advised that for the month of April, a larger Stock Trading Alerts will be provided on Fridays, but we will keep you updated in the meantime should anything major happen during the week.
Thank you and look forward to Friday's report!
Matthew Levy, CFA
Stock Trading Strategist
Thank you for reading today’s free analysis. If you would like to receive daily premium follow-ups, I encourage you to sign up for my Stock Trading Alerts to also benefit from the trading action described - the moment it happens. The full analysis includes more details about current positions and levels to watch before deciding to open any new ones or where to close existing ones.
Thank you.
Matthew Levy, CFA
Stock Trading Strategist -
Tax Hikes are Coming
March 31, 2021, 9:19 AMEnd of the month and first quarter of 2021. Is time going fast or slow? Markets have been moving at a dizzying pace to start the year.
As a side note, this will be our last newsletter for this week because the market is closed on Friday (Apr. 2).
The first quarter of 2021 is officially almost finished. Time flies when you’re having fun, right? While a broad correction did not happen by now, as I expected, the Nasdaq did enter correction territory twice since February. Despite the Nasdaq’s muted moves on Tuesday (Mar. 30), it’s right on the edge of its third foray into correction territory.
The market themes remain. There is still as much uncertainty for tech stocks today as there were at the start of March. Until there’s some clarity on inflation and bond yields, I can’t foresee this ending anytime soon.
Consider this too. President Biden is about to unveil a $2 trillion infrastructure plan during Wednesday’s session (wasn’t it supposed to be $3 trillion?). While this is great for America’s crumbling infrastructure, let’s be honest- does this economy, while recovering, need anymore spending?
Plus, how do you think he will pay for this? Hiking taxes- namely corporate taxes. Those gains that high growth stocks saw after Trump cut corporate taxes in 2017 could very well go away. The market may have priced in a lot of optimism. It may have already priced in some pessimism from potential inflation. But one thing it has not priced in is a possible tax hike.
This concerns me.
Rising bond yields + Rising taxes= A double whammy of bad news for tech stocks.
However, despite the “what ifs,” for now, three pillars remain in motion as a strong backdrop for stocks:
- Vaccines
- Dovish monetary policy full of stimulus
- Financial aid
My goal for these updates is to educate you, give you ideas, and help you manage money like I did when I was pressing the buy and sell buttons for $600+ million in assets. I left that career to pursue one to help people who needed help instead of the ultra-high net worth.
With that said, to sum it up:
The market has to figure itself out.
More volatility is likely, and we could experience more muted gains than what we’ve come to know over the last year. Inflation, interest-rate worries, and the potential for tax hikes should be the primary tailwinds. However, a decline above ~20%, leading to a bear market, appears unlikely for now.
Hopefully, you find my insights enlightening. I welcome your thoughts and questions and wish you the best of luck.
Russell 2000- Time to Pounce?

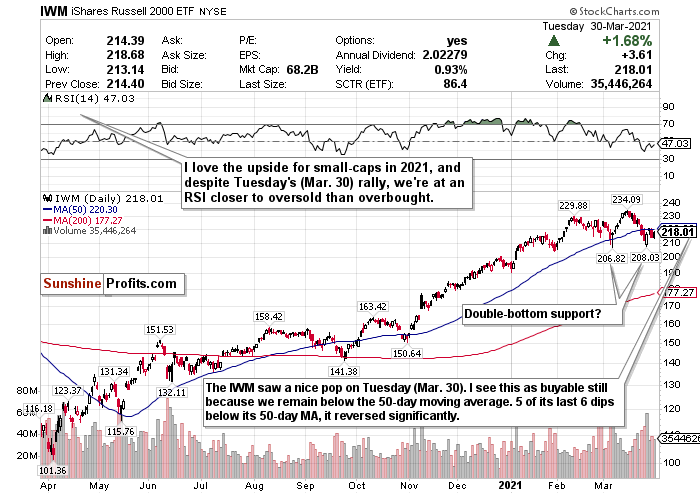
Figure 1- iShares Russell 2000 ETF (IWM)
The climate right now supports the Russell 2000. The current economic policy is tailor-made for small-caps. The best part, though? The Russell is still very buyable.
I kicked myself for not calling BUY on the Russell after it saw a minor downturn during the second half of February. I wasn’t going to make that mistake again.
After the iShares Russell 2000 ETF (IWM) went on its latest rally to start March, I checked out the chart. I noticed that almost every time it touched or minorly declined below its 50-day moving average, it reversed.
Excluding the recovery in April from last year’s crash, 5 out of the previous 6 times the Russell did this with its 50-day, it saw a sharp reversal. The only time it didn’t was in October 2020, when the distance between its 50-day and its 200-day moving average was a lot more narrow.
Fast forward to Tuesday (Mar. 23). The Russell 2000 saw its worst day since February 25, dropped below its 50-day, and I switched the call to a BUY.
Now, as we start the final week in March, we may be looking at the 6th reversal after dipping below its 50-day. The IWM has been up about 3% since March 24.
Aggressive stimulus, friendly policies, and a reopening world bode well for small-caps in 2021. I think this is something you have to consider for the Russell 2000 and maybe overpay for.
Consider this too. The Russell is on track for its first losing month in almost five months. According to the chart, it may have also found double-bottom support.
Based on macro-level tailwinds, its first losing month in five, potentially finding double-bottom support, its RSI, and where it is in relation to the 50-day moving average, I feel that this is a solid time to BUY.
For more of my thoughts on the market, such as tech, inflation fears, and why I love emerging market opportunities, sign up for my premium analysis today.
Thank you for reading today’s free analysis. If you would like to receive daily premium follow-ups, I encourage you to sign up for my Stock Trading Alerts to also benefit from the trading action described - the moment it happens. The full analysis includes more details about current positions and levels to watch before deciding to open any new ones or where to close existing ones.
Thank you.
Matthew Levy, CFA
Stock Trading Strategist
Free Gold &
Stock Market Newsletter
with details not available
to 99% investors
+ 7 days of Gold Alerts
Gold Alerts
More-
Status
New 2024 Lows in Miners, New Highs in The USD Index
January 17, 2024, 12:19 PM -
Status
Soaring USD is SO Unsurprising – And SO Full of Implications
January 16, 2024, 8:40 AM -
Status
Rare Opportunity in Rare Earth Minerals?
January 15, 2024, 2:06 PM

