

-
Just Ahead - the Looming & Serious Attempt at Feb Highs
August 18, 2020, 9:05 AMTrading in a tight range again, stocks are set up for a sizable move - and if you look at the credit markets, I think a break of the Feb highs is at hand. Don't be taken in by the lackluster daily advance decline line or advance-decline volume - $VIX doesn't appear ready to mount an immediate challenge, and neither is the dollar.
Such were my August 11 observations:
(...) With the dollar rally running into headwinds yet again, the risk-on trades gets another ally.
Last but not least, the correction in gold I called for on Friday to happen, takes away from the momentary inflation fears. And inflation rearing its ugly head, that would have the power to throw the stock bull out of whack. We aren't there yet.
The greenback is probing its recent lows again, gold is recovering from the preceding steep correction, and long-term Treasuries have stabilized. Such a combination is momentarily conducive to the budding stock upswing (watch Walmart data coming in) - my June 5 point about stocks remains valid also today, because stocks:
(...) don't love many things more than money printing.
The analyses in the coming few days will be briefer that you're used to from me, but rest assured that behind the scenes, I am looking at the very same broad set of charts that power my trading decisions. For business reasons related to your Stock Trading Alerts, I want to thank you for your patience before the number of charts presented comes roaring back later this week.
So, what markets have I picked today as the gems having most bearing upon the S&P 500 immediate future?
S&P 500 in the Short-Run
I'll start with the daily chart perspective (charts courtesy of http://stockcharts.com ):
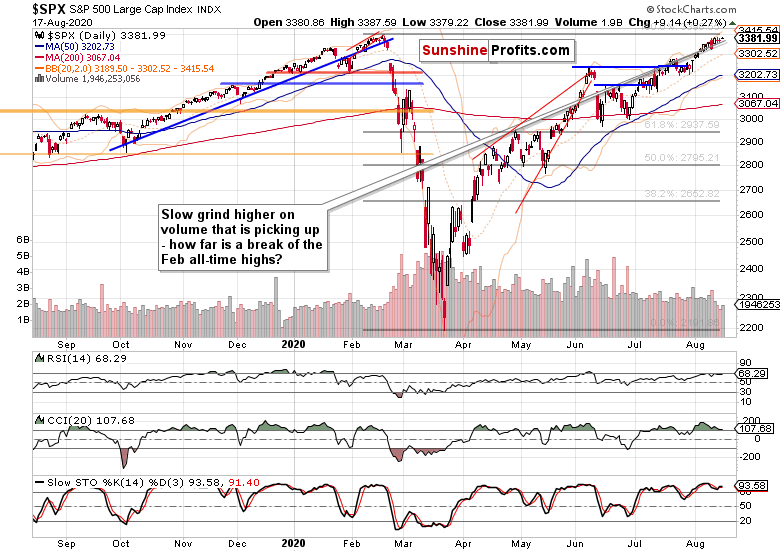
The short-term hesitation in the S&P 500 daily chart appears to be drawing to its end. The turn in the volume makes me think that increasing market participation is on the horizon, and if credit markets are any guide to go by, chances are stocks will move higher next.
The Credit Markets' Point of View
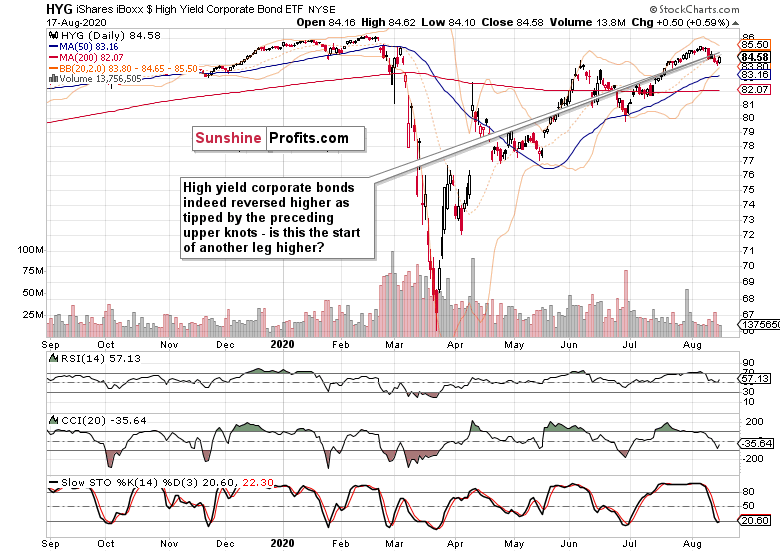
High yield corporate bonds (HYG ETF) have turned, though the volume didn't convince just yet. Coupled with sideways to higher price action next though, is what would lend more credibility to the credit market upswing, which is by the way mirrored to a certain degree with the stabilization in investment grade corporate bonds (LQD ETF).
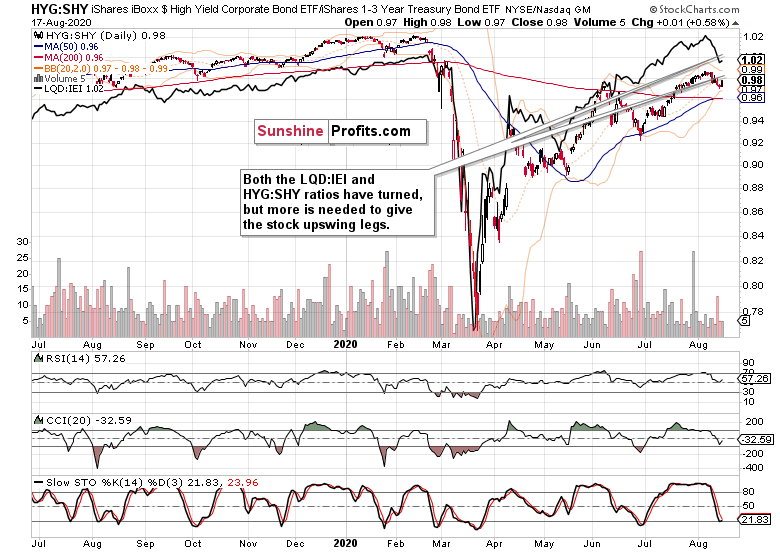
Both leading credit market ratios - high yield corporate bonds to short-term Treasuries (HYG:SHY) and investment grade corporate bonds to longer-dated Treasuries (LQD:IEI) - have risen yesterday.
Should such encouraging price action continue (and looking at Treasuries, chances are it would), that would take some pressure from the still relatively extended S&P 500 prices when compared to the HYG:SHY ratio.
In other words, less headwind for the stock uptrend.
Summary
Summing up, the S&P 500 upswing still has higher odds of continuing than not, and the reasons go beyond the nascent turnaround in the credit markets including the PHB:$DJCB ratio. The Russell 2000 keeps acting strong, and emerging markets have assumed leadership among the stock indices. Copper refused to decline yesterday yet again, and Baltic Dry index is also rising. Put/call ratio has turned higher, giving firepower to the less crowded bullish side of the trade than was the case a few days ago.
As I wrote yesterday, the economic recovery story is gaining traction, and stocks are likely to be helped in their upswing once long-dated Treasuries level off, which they are doing as we speak. Given technology performance, the stock bulls aren't looking to be holding the short end of the stick.
Thank you for reading today's free analysis. If you would like to receive daily premium follow-ups, I encourage you to sign up for my Stock Trading Alerts to also benefit from the trading action described - the moment it happens. The full analysis includes more details about current positions and levels to watch before deciding to open any new ones or where to close existing ones.
Thank you.
Monica Kingsley
Stock Trading Strategist
Sunshine Profits: Analysis. Care. Profits. -
The Case for Higher Stock Prices
August 17, 2020, 9:34 AMRefusing to decline or rise intraday, stocks are getting ready for a sizable move - and I think it would be to the upside. But it might not happen without moving lower first, as the flattening $VIX shows. The advance decline line doesn't really bring much short-term clarity to the picture either, but the bullish percent index is solidly in a bull market territory.
And in times as trying the patience as these, that's what hints at what the prudent course of action is. Stepping back, and checking the big picture. Are the bullish premises still valid? Any cracks in the dam emerging?
I still see that the bulls deserve the benefit of the doubt, and the reasons why follow.
S&P 500 in the Medium- and Short-Run
I'll start today's flagship Stock Trading Alert with the weekly chart perspective (charts courtesy of http://stockcharts.com ):

Such were my comments on the weekly chart 7 days ago:
(...) Bullish price action for many recent weeks on volume that isn't yet inviting increasing participation of the sellers. This fact alone bodes well for higher stock prices in the medium-term, but the buyers will meet a set of two key resistances shortly.
It's the Feb all-time highs that are drawing nearer day by day, and the upper border of the rising black trend channel.
The measured move higher continued, and volume decreased again, which doesn't point to the bears' willingness to step in just yet. Given the background of no stimulus deal thus far, and the election uncertainties going beyond taxation, that's actually encouraging.

The daily chart shows the S&P 500 hesitation in short run perfectly. Volume is progressively declining, and a bigger price move is needed to entice market participants to act. And odds are, that it would be in line with the predominant direction, which means higher.
The Credit Markets' Point of View

High yield corporate bonds (HYG ETF) can't find a strong bid lately, but the selling pressure appears abating. And so is the pace of daily declines losing steam to a degree.
Does the recent string of lower prices usher in a downtrend? Doesn't seem so just yet. Thus, I view it as a correction within an uptrend. As a consolidation while waiting for the coming Fed move as it comes to weekly balance sheet increases, and more positive economic news.
But the markets are about so much more than the Fed - the central bank is just one player, though with the deepest pockets. This is where other debt instruments come into play, and I mean the high quality ones, especially Treasuries.
First though, let's take a look at investment grade corporate bonds (LQD ETF) just below.

The investment grade bonds' dynamic is quite similar to their high-yield counterparts - both are declining, yet could see stabilization shortly. And as the 50-day moving average and early July lows have been reached in LQD ETF, the high-quality bonds might lead the way higher.

Very long-term Treasuries mirror the deceleration of the plunge. But it's especially within these instruments that I see a confirmation of the real economy recovery story, and the justification of why rising yields will translate into higher stock prices.
Take a good look at early June - Treasuries were plunging in the runup to the surprise non-farm payrolls gain that corresponded with the upside breakout above the rising wedge on the S&P 500 daily chart. This raises the likelihood we'll see an upswing in stocks this time around too.
Smallcaps, Emerging Markets and Other Clues

Over the very recent sessions, the Russell 2000 (IWM ETF) was acting weak, but let's not forget that it broke above it early June highs earlier. This makes the currently retreating prices a correction within an uptrend as the smallcaps aren't losing sight of the 500-strong index.

Neither the emerging markets (EEM ETF) are signaling danger - after outperforming since the start of July, they're taking a breather currently. The base they're building, will give way to another upswing (that's the more probable scenario).

Copper keeps consolidating preceding months' sharp gains, and appears less and less likely to decline as time passes by. Should it take on the $3 level successfully, that would be another vote of confidence in the nascent economic recovery.
Let's recall my Friday's observations on the metal with PhD. in economics:
(...) yesterday's lower knot indicates that the bulls have stepped back to a degree. That increases the probability that once trading leaves this flag, they will do so with a break higher.

Technology (XLK ETF) keeps consolidating with a bullish bias, and remains the leading S&P 500 sector. Healthcare (XLV ETF) is pausing, while financials (XLF ETF) are showing promising signs of life.
Summary
Summing up, S&P 500 has been going nowhere lately, and the market sentiment can be characterized as one of greed. Encouragingly for the bulls though, the bears are coming back to life as the slowly rising put/call ratio shows - that means the bullish side of the boat got less crowded. The economic recovery story is gaining traction, and stocks are likely to be helped in their upswing once long-dated Treasuries level off, which could help corporate bonds catch a strong bid again.
While the air near the Feb all-time highs is quite thin, the bulls aren't looking to be at the end of their rope.
Thank you for reading today's free analysis. If you would like to receive daily premium follow-ups, I encourage you to sign up for my Stock Trading Alerts to also benefit from the trading action described - the moment it happens. The full analysis includes more details about current positions and levels to watch before deciding to open any new ones or where to close existing ones.
Thank you.
Monica Kingsley
Stock Trading Strategist
Sunshine Profits: Analysis. Care. Profits. -
Will Credit Markets Pull Stocks Down - Or Not?
August 14, 2020, 10:00 AMAnother day, another attempt at the Feb highs, and the upper knots of S&P 500 candlesticks give the daily chart a bearish look. How justified is that - are stocks about to move seriously lower?
In today's analysis, I'll present the outlook based on the many charts featured.
S&P 500 in the Short-Run
I'll start with the daily chart perspective (charts courtesy of http://stockcharts.com ):

The S&P 500 didn't make it far yesterday, and both the upswings and downswings have been rejected. The volume declined, which means that most market participants are largely sitting on the sidelines.
However, this could cbange in a heartbeat. Will the bears be as strong so as to send the bulls packing?
According to the credit markets, it's a close or not so close tie - have your pick.
The Credit Markets' Point of View

High yield corporate bonds (HYG ETF) recovery fizzled out yesterday, and prices closed at new lows. Does the high volume mean the bears are getting started, or that a meaningful accumulation is underway?
The next few days will be telling, especially when I look at investment grade corporate bonds (LQD ETF) just below.

They haven't found a bottom yet as the last five trading days in a row show.

Both leading credit market ratios - high yield corporate bonds to short-term Treasuries (HYG:SHY) and investment grade corporate bonds to longer-dated Treasuries (LQD:IEI) - are currently pointing down.
Will the investment grade bonds find the way higher first, just as they did in May or June - and will that be enough to promptly turn around their junk counterparts?

The overextension of the S&P 500 (black line) relative to the HYG:SHY ratio is even more striking now. But stocks still continue to defy gravity. Will a resolution with a stock move lower or ratio's move higher follow? I am leaning towards the latter, in its time that might be closer at hand than the bears think.
Smallcaps, Emerging Markets and Other Clues

The Russell 2000 (IWM ETF) is holding up quite well relative to the 500-strong index. No sign of profit distribution here.

Neither the emerging markets (EEM ETF) are signaling danger - after outperforming since the start of July, they're taking a breather currently.

The daily market breadth chart caption says it all. The deterioration is visible, and the question remains when would the bulls step in. Remember, the bullish percent index remains solidly in bullish territory (making corrections likely to be bought), and stock price action hasn't shown us that it's willing to roll over in earnest though.

The metal with PhD. in economics has given up this week's gains, yet yesterday's lower knot indicates that the bulls have stepped back to a degree. That increases the probability that once trading leaves this flag, they will do so with a break higher.
Summary
Summing up, yesterday's S&P 500 session leaves stocks extended relative to the credit markets, and neither long-dated Treasuries are signaling an immediate turnaround just yet. Much depends upon today's trading in the debt instruments, and I think that the worst of the decline there is past, and that higher prices would follow and help put a floor behind the relatively very extended S&P 500 vs. HYG:SHY.
The same goes for the S&P 500 market breadth indicators, where I also see stabilization followed by an upswing in the advance-decline line as the more probable scenario. And that means that the bulls better approach any trading opportunities with tight trade parameters (just as I did throughout many recent sessions), because the air near the Feb all-time highs is quite thin.
Thank you for reading today's free analysis. If you would like to receive daily premium follow-ups, I encourage you to sign up for my Stock Trading Alerts to also benefit from the trading action described - the moment it happens. The full analysis includes more details about current positions and levels to watch before deciding to open any new ones or where to close existing ones.
Thank you.
Monica Kingsley
Stock Trading Strategist
Sunshine Profits: Analysis. Care. Profits.
Free Gold &
Stock Market Newsletter
with details not available
to 99% investors
+ 7 days of Gold Alerts
Gold Alerts
More-
Status
New 2024 Lows in Miners, New Highs in The USD Index
January 17, 2024, 12:19 PM -
Status
Soaring USD is SO Unsurprising – And SO Full of Implications
January 16, 2024, 8:40 AM -
Status
Rare Opportunity in Rare Earth Minerals?
January 15, 2024, 2:06 PM

