

-
Yesterday Was Supposed To Be a Reversal, Right?
May 22, 2020, 8:51 AMStocks have closed between two strong resistances yesterday - between the upper border of March's gap and the 61.8% Fibonacci retracement. But the overnight rise in US-China tensions (this time, regarding Hong Kong), sent the S&P 500 futures below the key Fibonacci retracement. Can stocks recover and finish the job of breaking higher?
While it may not happen today, it's nonetheless still likely in the near future.
S&P 500 in the Short-Run
Let's start with the daily chart perspective (charts courtesy of http://stockcharts.com ):

Stocks are increasingly cutting into the combined resistance posed by the early March gap and the 61.8% Fibonacci retracement, and this week's daily downswings were only able to achieve higher lows. It means that it's two steps forward, one step backwards for the stock bulls.
Apart from the Hong Kong jitters, there hasn't been any other catalyst or development that would prompt the markets to reassess the risks. While it's true that there needn't be a catalyst, the overnight move lower appears of limited shelf life. Flash in the pan, in other words. The chart posture remains bullish, and we see it likely that the buyers would take on the 200-day moving average (that's around 3000) before too long.
Yesterday's volume doesn't mark a reversal either, and the daily indicators keep supporting the unfolding upleg. When will more buyers jump onboard? Once they do, we expect FOMO (fear of missing out) to become dominant over the wait-and-see approach of this extended consolidation.
Yes, it proved to be a consolidation, because no matter how bearish or bullish the indications for a move either way, stocks kept frustrating both the buyers and sellers equally. As a rollover to the downside never came, the chart pressure to move higher keeps building with each passing day and week, in our opinion.
The Credit Markets' Point of View

High yield corporate debt (HYG ETF) didn't really move lower yesterday, and the daily volume hints at merely a daily consolidation of recent gains. This leading metric of credit market health is primed to go higher, and serve as a tailwind for stocks.

Yesterday's pullback in stocks appears no cause of concern, as it's just a short-term breather during the daily consolidation in the high yield corporate bonds to short-term Treasuries ratio (HYG:SHY).
Key S&P 500 Sectors and Ratios in Focus

Yesterday's sizable red candle lacked volume to make it stand out, which is why we think it's just a daily event. Once it plays out entirely, tech will likely move higher again, pulling the index along.

Healthcare (XLV ETF) would be an unlikely ally in the stock upswing resumption. Actually, that was a quip - it wouldn't be at all unlikely and definitely not out of the blue. The slight increase in yesterday's volume coupled with half of intraday losses being erased, speaks in favor of higher values not too far ahead.

Alongside the HYG ETF, financials (XLF ETF) held steady yesterday, and the decreasing volume together with the daily indicators' posture (they haven't rolled over to the downside) favors the move higher to continue, and break above the early May highs.
Once again, consumer discretionaries (XLY ETF) refused to move lower while the consumer staples (XLP ETF) declined. The predictable result is another move higher in the consumer discretionaries to staples ratio (XLY:XLP). These were our yesterday's thoughts about the importance as it:
(...) is already trading well above its February highs. Given the degree of real economy destruction seen around, that's quite a signal this leading indicator is sending. The financials to utilities ratio (XLF:XLU) looks to have stabilized not too far from the declining resistance line connecting its mid-March and early-May intraday tops, and it's our opinion that it would go on to break higher.
The XLF:XLU ratio probed the above-mentioned declining resistance line. While it didn't break higher yet, it didn't decline either. Our expectations for it to break higher remain intact.
Among the stealth bull market trio, there was no breakthrough either way yesterday. Energy (XLE ETF) moved lower, but didn't give up this week's gains. Neither did materials (XLB ETF). Comparatively, industrials (XLI ETF) performed best. Overall, that marks consolidation of recent gains, and building a base for an eventual launch higher across these sectors. Yes, that's true despite the lower low made last week in industrials, or retesting it in materials.
Summary
Summing up, yesterday's decline doesn't pose an obstacle for the bullish outlook for the S&P 500. Its overnight part being headline-driven would likely be of limited lasting power, and we expect stocks to break above both formidable resistances on a lasting basis. Yes, the 61.8% Fibonacci retracement breakout will likely be confirmed, and so will the upper border of the early March gap. Both the credit market and sectoral strength examination supports this conclusion. Thereafter, the bulls would target the 200-day moving average at around 3000. That's for starters, as we expect to slowly grind higher overall despite the high likelihood of sideways-to-slightly-down trading over the summer. But before that, the ball remains in the bulls' court.
If you enjoyed the above analysis and would like to receive daily premium follow-ups, we encourage you to sign up for our Stock Trading Alerts to also benefit from the trading action we describe - the moment it happens. The full analysis includes more details about our current positions and levels to watch before deciding to open any new ones or where to close existing ones.
Thank you.
Monica Kingsley
Stock Trading Strategist
Sunshine Profits - Effective Investments through Diligence and Care -
This Key Resistance Breakout Is Where the Rubber Meets the Road
May 21, 2020, 10:33 AMTuesday's refusal of the stock upswing didn't really stick, and the S&P 500 opened higher. Trading with an upward bias during the session, the index closed comfortably above the 61.8% Fibonacci retracement. As outlandish as it might seem, does it denote a new bull market being on the way? It just can't be overstated how crucial this level is to the stock market outlook...
S&P 500 in the Short-Run
Let's start with the daily chart perspective (charts courtesy of http://stockcharts.com ):

Cutting into the 61.8% Fibonacci retracement several times already, stocks are on a slow but steady move this week. It's as well the early March gap that they're challenging. While the S&P 500 just closed above the Fibonacci retracement (that's around 2940), the gap's upper border stands still unbeaten.
Yesterday's volume doesn't mark a spike where the buyers would be falling over themselves to enter into the market, but it's not representative of a reversal either (thanks to closing relatively near the intraday highs). It's just on the lower end of the average spectrum, which would be consistent with a gradual upswing development. Is it that neither the buyers nor the sellers believe it? By believe, we mean to be ready to get into the market in droves, in place of a wait-and-see position.
The daily indicators keep supporting the unfolding upleg. Will they convince more buyers to enter the fray with passing time? As we see the grind higher in fits and starts as the most likely scenario, it's probable.
The Credit Markets' Point of View

High yield corporate debt (HYG ETF) keeps providing tailwind for the move higher in stocks. On sizable volume and near its intraday highs, this leading metric of credit market health overcame the late April and early May highs. With its daily indicators supporting further gains, how does the broad credit market performance reflect upon the stock advance?

Stocks aren't getting ahead of themselves. The high yield corporate bonds to short-term Treasuries ratio (HYG:SHY) keeps being in accord with the march north in the overlaid S&P 500 chart (the black line).
Key S&P 500 Sectors and Ratios in Focus

To illustrate the point, have you seen how easily technology (XLK ETF) overcame Tuesday's daily setback? In our yesterday's analysis, we noted that the daily reversal lower on a not so outstanding volume means that the uptrend is intact. And it is.
Healthcare (XLV ETF) couldn't keep its opening gains yesterday, and remains very much range-bound. Financials (XLF ETF) gave up their intraday gains, but their bullish opening gap remains intact as they're knocking on the door of the early May highs in an attempt to overcome them.
Consumer discretionaries (XLY ETF) refused to close its opening bullish gap, and instead consolidated sizable opening gains. While consumer staples (XLP ETF) rose as well, they relatively underperformed the discretionaries.
As a result, believe it or not, the consumer discretionaries to staples ratio (XLY:XLP) is already trading well above its February highs. Given the degree of real economy destruction seen around, that's quite a signal this leading indicator is sending. The financials to utilities ratio (XLF:XLU) looks to have stabilized not too far from the declining resistance line connecting its mid-March and early-May intraday tops, and it's our opinion that it would go on to break higher.
Among the stealth bull market trio, energy (XLE ETF) performed best. Together with materials (XLB ETF) and industrials (XLI ETF) though, they've been largely consolidating last two days' gains. Consolidating with a bullish bias, that is - and that bodes well for the stock rally to continue at its own pace.
From the Readers' Mailbag
Q: I switched jobs and was in the process of moving my 401k directly from one company to another. The old company sent a paper check to me cashed out on March 12th..a low point. I have to put the check into my new 401k account. waited for market to go back down but never happened. Now i will be buying higher than sold. I have the check to the 401k company FBO myself -What are my options if any?
A: Let me give you an answer that doesn't constitute any tax accounting or similar advice, and concentrates instead on the stock market situation at hand, and how I would approach the matter were I in your shoes.
First things first - it's not a shame to buy higher, if the outlook is correspondingly bullish. You're assessing the outlook, and not a price point by itself.
Off the all-time February highs, stocks dived to the March 23 lows. The recovery has been similarly steep, and eventually overcame the resistance posed by the 38.2% Fibonacci retracement in early April. All right, but should the bear market be alive and well still at that time, stocks should have very real trouble overcoming the 50% Fibonacci retracement.
And they did have issues, and it was only last week that they refused to plunge below it again. So, they kind of left the glass half full, half empty. That would give a big-picture impression of possible, yet not outrageously large gains ahead, or just muddling through directionless for some time.
Now, we see stocks taking on the 61.8% Fibonacci retracement, in what would mark a transition to a stock bull market. And it stands a pretty good chance of coming true, regardless of all the suffering in the real economy. This is a third attempt to overcome this key resistance, so it again speaks of a thorny road ahead. Thorny, but mostly higher on low volatility compared to Q1- and as we expect the breakout to succeed, it would attract new institutional money alongside more retail investors. Not that the latter wouldn't be coming already (money market outflows show that).
One more point in support of the new bull market theory and against retesting or breaking below the March lows. If you look at similar post WWII situations in stocks, and see how the S&P 500 performed since reaching the 50% Fibonacci retracement average, the current situation, despite all the corona facts, hysteria and tidal wave of bankruptcies ahead, is taken as no big deal. I mean, stocks are pretty much following the average case scenario.
And that's a steady climb higher at a not too steep a pace. By not too steep, I mean almost a straight line pointing to stocks around 3050 quite before the Labor Day. Right now, stocks are fairly reasonably priced, and it should be noted that even the worst case scenario would take them only to the low 2600s during the summer. That's not such a large downside that stocks could suffer if you consider the real world as seen through your very own eyes.
That's how I see the table set for the upcoming weeks. Of course, the runup to the elections and the possible arrival in earnest of the second corona wave would decide whether stocks go on to march higher (quite possibly faster than before considering the great uncertainty removed), or point lower next. Either way, we would get plenty of advance warnings - the current situation simply requires chart reading, methodology and being attuned to the fundamental developments and interventions, all on a daily basis.
Now comes the being in your place part. I would either look for overshoots to the downside from the ideal path forward in stocks over the summer, and allocate capital to buy when we get temporary discounts. Yes, that means disregarding the fact that financial markets are the only place where buyers run out of the store screaming in fear whenever a discount presents itself.
Or I would just go the dollar-cost-averaging path, meaning I would allocate a certain portion of the funds to place at steady intervals over time in what is essentially giving up on trying to time the market. Both attempts have their pros and cons, and it's essentially about the time and emotional capital you want to invest...
What is not part of your question, but still needs to be answered in one breath, is where I would allocate those funds. Then, there is the distant time horizon of a 401(k).
While we can count on financial repression to go on and keep yields relatively low, remember that during the 1980s, Treasuries were jokingly called certificates of guaranteed confiscation. Given the inflationary clouds ahead, you'd stand a better chance in Treasury inflation-protected-securities (TIPS), laddered bond portfolio of your own making (yes, buying individual bonds and keeping them till maturity), or even going for dividend aristocrats (these are stocks with decades-old history of paying out dividends and raising them constantly along the way - these are your Coca Colas or Procter & Gambles and the like).
Heck, even some technology stocks behave in a way that can be similarly taken advantage of. I personally view the Microsoft or Apple charts as bullish - and this is just two of the many greatly-performing tech stocks. The tech sector is primed for more gains, and healthcare is too - these heavyweights have the brightest prospects in 2020.
The above shows the vulnerability of having to cash out of the market at an inopportune time. That messes up with lifetime planning (just as the two bear markets in 2000s did), and the above thoughts represent my top of mind ideas to deal with it gracefully.
Summary
Summing up, Tuesday's decline was erased before the market open already, and the S&P 500 had kept the bullish intraday bias since. But this isn't about such a short time frame only - both the credit market performance and sectoral analysis keep pointing in the direction of more stock gains to come. The bulls' first objective is to confirm the breakout above the 61.8% Fibonacci retracement by three consecutive closes higher, and to overcome the early March bearish gap (its upper border is at around 2970) in a show of strength. Thereafter, the bulls would target the 200-day moving average at around 3000. That's for starters, as we expect to slowly grind higher overall despite the high likelihood of sideways-to-slightly-down trading over the summer. But before that, the ball remains in the bulls' court.
If you enjoyed the above analysis and would like to receive daily premium follow-ups, we encourage you to sign up for our Stock Trading Alerts to also benefit from the trading action we describe - the moment it happens. The full analysis includes more details about our current positions and levels to watch before deciding to open any new ones or where to close existing ones.
Thank you.
Monica Kingsley
Stock Trading Strategist
Sunshine Profits - Effective Investments through Diligence and Care -
Should We Really Be Concerned By Yesterday's S&P 500 Pullback?
May 20, 2020, 8:44 AMDespite yesterday's bearish opening gap, the bulls closed it, taking prices higher in a very measured and cautious way. Then, the bears took over the reins and drove the index well below the levels at the start of the day. Have we seen a reversal?
In short, that's very unlikely - and not only because of the low volume of yesterday's downswing...
S&P 500 in the Short-Run
Let's start with the daily chart perspective (charts courtesy of http://stockcharts.com ):
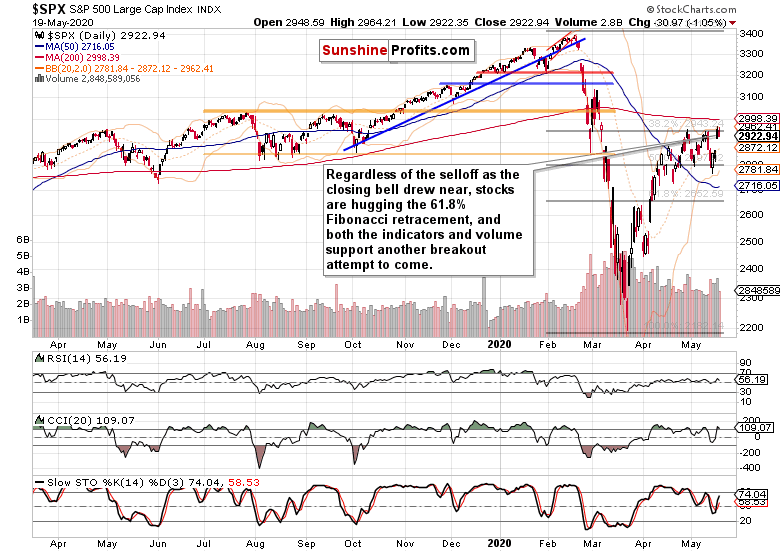
The much anticipated Powell testimony, along with Treasury Secretary Mnuchin, was treated by the market place as a non-event. Stocks recovered from the initial setback, and it was only the final 75 minutes of trading that took them down. While the slide may have looked impressive given the low intraday volatility, has it achieved anything lasting and of importance?
Both the volume and daily price action examination hint at merely a consolidation in an unfolding upleg. Stochastics is still on its buy signal, the CCI in the uptrend territory, and we better not read too much into the RSI curling lower. On balance, the daily indicators are supporting the bullish case and another breakout attempt over the 61.8% Fibonacci retracement. Metaphorically speaking, stocks are like a coiled spring now.
The importance of overcoming this resistance can't be overstated for the institutional investors. With the rise of passive investing we've seen over the decade (yes, it had more assets under management than active investing for a good few years already), how much new buying will it bring in as the resistance is overcome? In our opinion, just enough to put a good floor below stocks. A market-based one, this time. And the examination of money flows from the money market funds supports that conclusion too, because last week's pullback was heavily bought.
But last week, it were the credit markets, that were profoundly lagging and flashing caution. What about now, have they sold off during yesterday's stock pullback?
The Credit Markets' Point of View
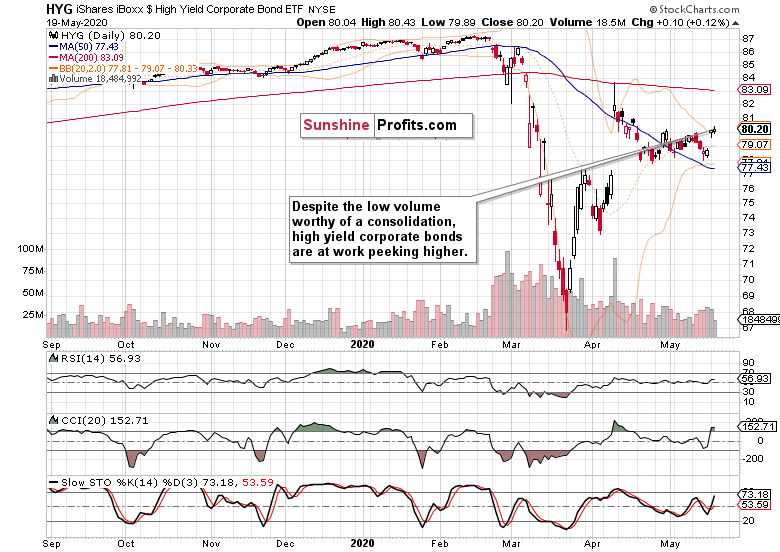
Absolutely not. High yield corporate debt (HYG ETF) kept its opening gains, and merely gave up some intraday ones. That's a short-term sign of outperformance, meaning the stock bulls have the wind in their sails.
Just as with stocks, yesterday's HYG ETF upswing happened on low volume, hinting that this hasn't been the real deal yet. It's likely just a consolidation before another corporate junk bonds upleg, in our opinion.
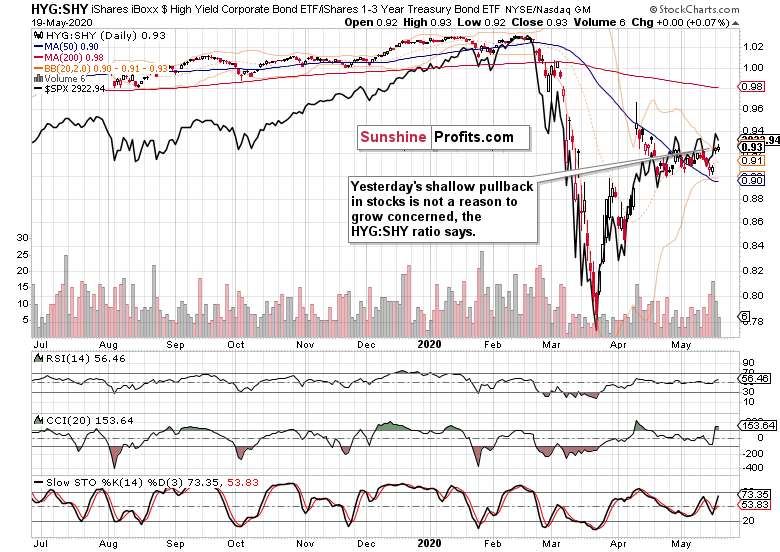
The high yield corporate bonds to short-term Treasuries ratio (HYG:SHY) also confirms our view that yesterday's shallow pullback in the overlaid S&P 500 chart (the black line), has been no game changer.
Key S&P 500 Sectors in Focus

Technology (XLK ETF) gave up its intraday gains, and reversed lower on a not so outstanding volume. In other words, its uptrend is intact - just look at the volume around last week's lows compared to previous two days' one. While the accumulation at the lows hadn't been above the volume of Wednesday's plunge, it has still been more pronounced than the distribution just seen. Coupled with the daily indicators' posture, that's another reason for why the march north will likely go on.
Healthcare (XLV ETF) declined yesterday, but remains pretty much range-bound. Financials (XLF ETF) also moved lower yesterday, but its indicators support another move higher as the sector appears getting ready to move clearly above the midpoint of its April range.
Despite the ominous daily reversal candle with sizable upper knot seen in the consumer discretionaries (XLY ETF), the sector didn't decline on outrageous volume. In other words, its move is consistent with merely a daily setback suffered. Importantly, it outperformed its defensive counterpart, the consumer staples (XLP ETF), which declined on the day - just as utilities (XLU ETF) did.
Among the stealth bull market trio, both energy (XLE ETF) and materials (XLB ETF) gave up most of their Monday's gains, with industrials (XLI ETF) holding up best. The volumes behind yesterday's declines within these three sectors don't mark a reversal either. Again, it's consistent with only a daily setback seen.
By the way, not even on yesterday's housing data coming in below expectations (yes, we mean the key ones - the actual housing starts), the real estate sector (XLRE ETF) didn't sell off dramatically. Its performance actually mirrors that of the financials, which shouldn't really be all that surprising.
From the Readers' Mailbag
Q: Do you think the "real economy bottom" is at hand? With 20% unemployment, massive debt, multiple small business failures, and a still raging virus, I would question that perception.
A: Well, if you count those who (almost magically) dropped out of the workforce, we're well over 20% unemployment. New jobless claims are one part of the story, but the continuing unemployment claims are more important. Sure, if you look around and see the retail sales, they are out of a horror show. But company earnings (prospects) have slowly started to turn the corner already.
Sure, the brick-and-mortar retail sector is suffering and among many other household names, JC Penney filed for bankruptcy. But please remember that these are beached whales that have been massively overbuilding well before the great financial crisis struck. The US simply has the most square feet per capita in the world, so the coronapocalypse is the straw that's breaking the camel's back here. Among the destruction though, creativity and online solutions in the sector abound - we're not looking at Amazon (AMZN) here.
But I agree that small business, the backbone of US economy, is suffering, and unfortunately will continue to do so. With the way the S&P 500 is structured (the weighting of the behemoths and importance of foreign sales especially should the dollar roll over - in my humble opinion, it will later this year), the index can continue higher still though, and probably more vigorously than the Russell 2000 (IWM ETF).
I also agree that we're in the ebbing stage of the virus, and the risk of a second wave is still very much there - regardless of the relative complacency that rules the day.
But still, the market perception, its discounting mechanism, is what counts. And the S&P 500 is very much willing to bridge the valley. Remember early April when Fauci was talking lockdown here, there, everywhere? The index obliged lower but just couldn't decline any more for several days, while we still saw the exponential rise in infections and were waiting for another shoe to drop. It didn't happen, and unless we see the June data (continuing unemployment claims, participation rate, retail, manufacturing and the like) coming in lower than those of May, the stock market is unlikely to sell off more than a couple of percent and enter a bear market territory (which is defined by a more than 20% decline).
Also, the sentiment data don't favor a really deep downswing - there are just too many bears out there. The forward-looking volatility measure, the VIX, also supports the stock upswing to continue, as its increases are associated mostly with stock selloffs. That's because stocks usually decline faster than they rise (we saw that yesterday on intraday basis). Look at the VIX, it's been trending lower, making a series of lower highs and lower lows since mid-March.
In closing, the real economy is just one factor in the S&P 500 equation, and you're right the real economy bottom might not have yet been reached. I agree, this is a mini-depression, and we're bound to find out what mini actually means in terms of time. Yet, it's the green shoots (e.g. the slowing pace of manufacturing's decline - see the Empire State Manufacturing Index) that stocks are acting upon (similarly to how they did in March and April 2009), and we have to deal with the stocks' perceptions first of all here.
Summary
Summing up, yesterday's decline into the closing bell didn't materially change the bullish perspective in stocks or upturn the credit markets. Corporate debt continues being supportive of the stock upswing, and the unfolding breakout (rigorously speaking, it takes preferably three sessions' closes higher to declare it confirmed) above the 61.8% Fibonacci retracement is likely to succeed this time. Thereafter, the bulls would target the 200-day moving average at around 3000. As outlined on Monday, while we don't expect a sizable selloff, we don't see dramatic gains as overly likely either. The best known measure of volatility, VIX, appears to support the bullish view over the coming weeks.
If you enjoyed the above analysis and would like to receive daily premium follow-ups, we encourage you to sign up for our Stock Trading Alerts to also benefit from the trading action we describe - the moment it happens. The full analysis includes more details about our current positions and levels to watch before deciding to open any new ones or where to close existing ones.
Thank you.
Monica Kingsley
Stock Trading Strategist
Sunshine Profits - Effective Investments through Diligence and Care
Free Gold &
Stock Market Newsletter
with details not available
to 99% investors
+ 7 days of Gold Alerts
Gold Alerts
More-
Status
New 2024 Lows in Miners, New Highs in The USD Index
January 17, 2024, 12:19 PM -
Status
Soaring USD is SO Unsurprising – And SO Full of Implications
January 16, 2024, 8:40 AM -
Status
Rare Opportunity in Rare Earth Minerals?
January 15, 2024, 2:06 PM

