

-
S&P 500 Grind Higher Goes On, Regardless of Daily Setbacks
May 27, 2020, 9:57 AMThe runup to yesterday's US open and the regular session's trading confirmed my call that stocks would break above the key resistances. And they did effortlessly overcome the upper border of March's gap and the 61.8% Fibonacci retracement without really looking back. Now that they trade also above the 200-day moving average, how far can the bull run reach?
S&P 500 in the Short-Term
Let's start with the daily chart perspective (charts courtesy of http://stockcharts.com ):
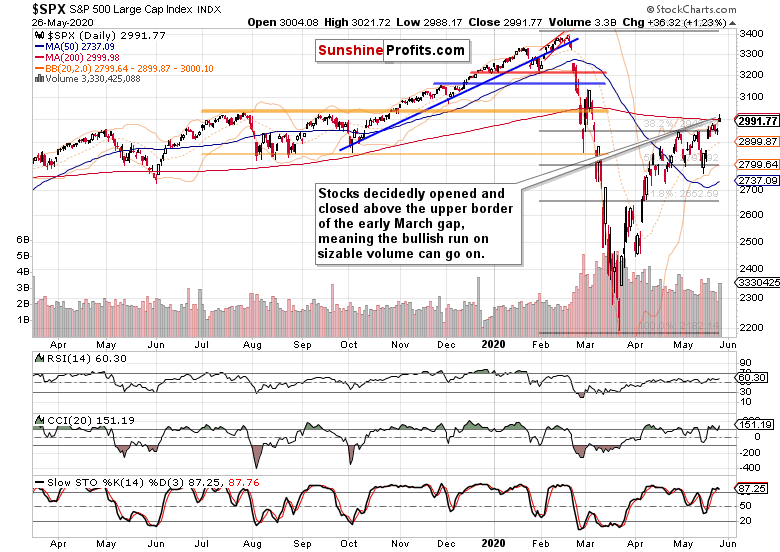
A resoundingly higher open followed by more buying before running out of steam 30 minutes before the closing bell - that's a fair characterization of yesterday's session. As it happened on reasonably high volume and the candle's shape isn't that of a profound reversal, the implications are bullish for the days to come.
It's been only the 200-day moving average that provided resistance to stocks yesterday, and while the sizable upper knot isn't a pleasant sight to see for the bulls, it will likely turn out to be a soon-forgotten mark in the slow grind higher that I expect to play out over the coming weeks. The best the bears can hope for in my opinion, would be a sideways digestion of recent gains.
That's because yesterday's session shows that the buying power is there, and the sellers haven't been able to bring prices down much.See this quote from yesterday's intraday Stock Trading Alert:
(...) Stocks are consolidating the sizable gains since Friday's closing bell, and it's accompanied by higher high yield corporate bond values.
Up till now, the S&P 500 consolidation is taking shape of a shallow sideways trading range ... The current price action appears to be a case of back-and-forth trading only, as we see no signs of an impending reversal to the downside to act upon.
Technology is having one of its weaker days today so far, while healthcare is still range-bound and financials are steeply higher. Neither real estate or consumer discretionaries are disappointing, and the stealth bull market trio (energy, materials, industrials) is higher too.
Would the credit markets' closing prices still confirm the bullish take on stocks?
The Credit Markets' Point of View
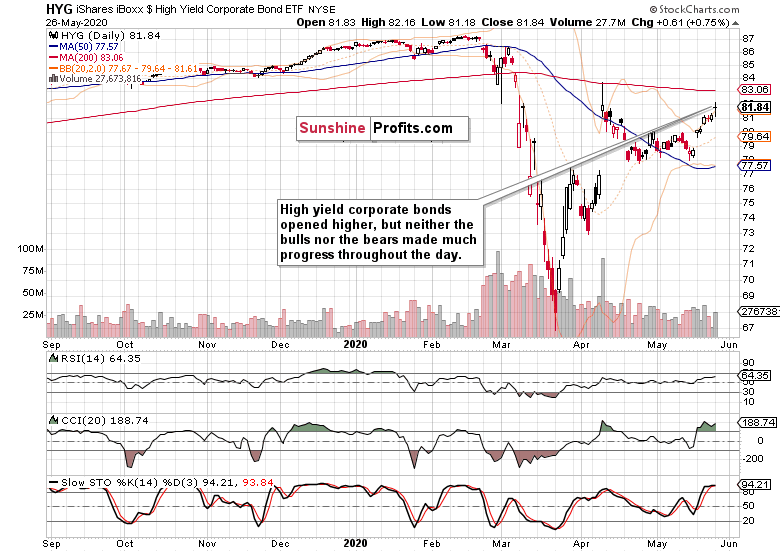
High yield corporate debt (HYG ETF) predictably opened higher yesterday, but just couldn't keep the intraday gains. On the other hand though, the bears didn't get their way either. On respectable volume, junk corporate bonds closed little changed from where they started the day, which means that we've most likely seen a daily consolidation only.
While further consolidation of recent sharp gains wouldn't come as a surprise, I think it's more probable that the bullish bias will prevail over the coming sessions, and that this leading metric of credit market health would go on to serve as a tailwind for stocks.
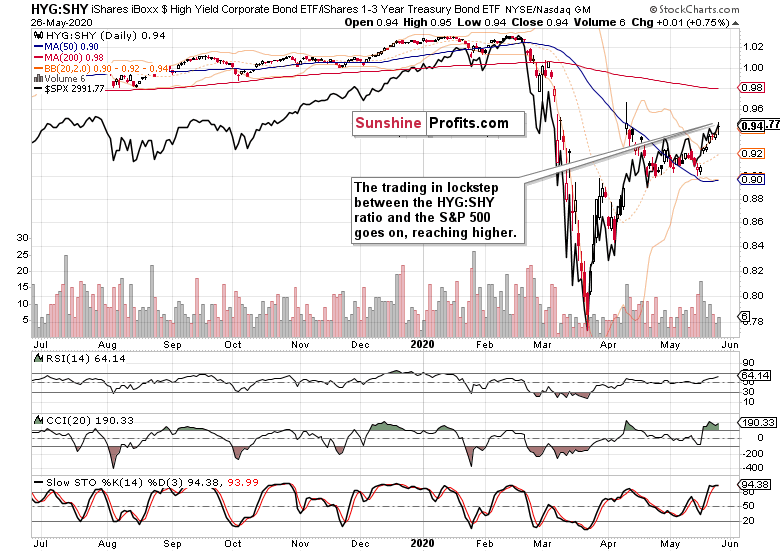
No material change here either - the moves in stocks and the high yield corporate bonds to short-term Treasuries ratio (HYG:SHY) continue to be moving in lockstep. Crucially for the stock bulls, this gauge of bullish spirits remains on their side. Simply put, the setback stock bulls suffered in the last 30 minutes of yesterday's regular session, is nothing the sellers could call home about.
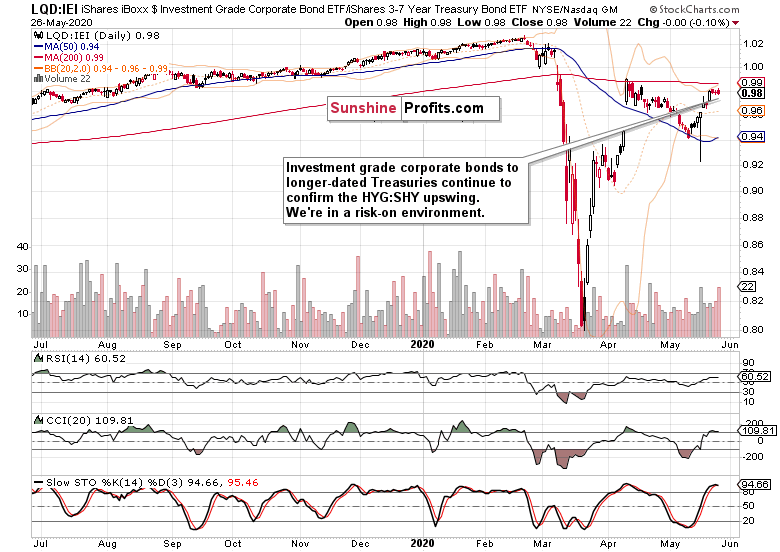
The ratio of investment grade corporate bonds to long-dated Treasuries (LQD:IEI) also shows no divergence when compared to the HYG:SHY ratio. It means that we're in a risk-on environment and the riskier HYG:SHY ratio is firmly in the driver's seat.
Key S&P 500 Sectors in Focus
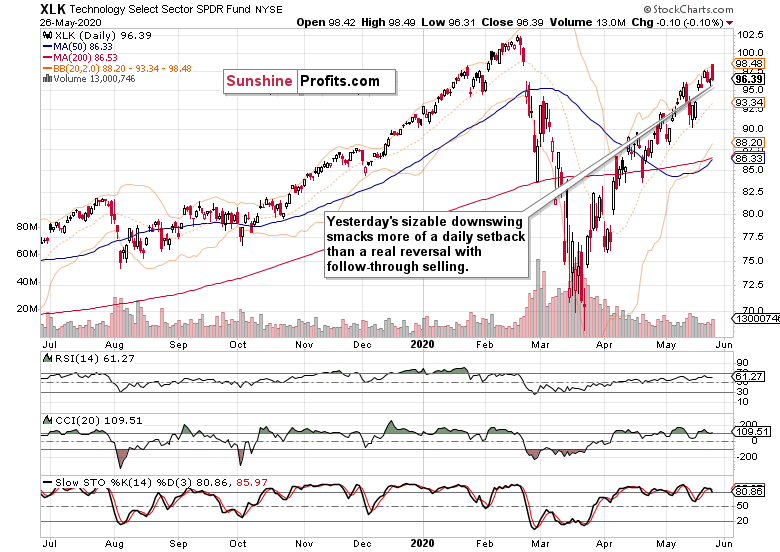
Technology (XLK ETF) was rejected at the gates of the upper border of the late-February bearish gap, declining powerfully in the last 30 minutes of the regular session. The volume was elevated, but nowhere representative of a real reversal that's about to stick. That makes me think any potential follow-through will be readily absorbed by the buyers, and we're likely to see yesterday's open overcome before too long.
Healthcare (XLV ETF) brought us another long red candle, but on relatively lower volume - and that means even smaller bearish short-term implications than could be the case for technology. In other words, I expect a return of the buyers in both of these key sectoral ETFs pretty soon.
Financials (XLF ETF) have been the star heavyweight performer of yesterday's session, coming within spitting distance of both April local tops. Financials rose on outstanding volume, and kept half of their intraday gains, which makes the outlook for coming days bullish.
So, we see the three sectors positioned for more gains, would the rest of the crowd agree?
Consumer discretionaries (XLY ETF) certainly would as they kept much of their opening gains intact, unlike technology. Real estate (XLRE ETF) also showed up strongly.
As for the stealth bull market trio, all three - energy (XLE ETF), materials (XLB ETF) and industrials (XLI ETF) - moved higher, with the industrials leading the pack. That's a bullish combination, boding well for stocks over the coming weeks.
Summary
Summing up, yesterday's session brought us powerful follow-through buying and less and less in terms of resistances is standing in the bulls' way. The 61.8% Fibonacci retracement and the early March gap are history, and soon will also be the resistance provided by the 200-day moving average. Both the credit market and sectoral analysis favor this bullish takeaway. So does the Russell 2000 upswing as stocks ignore the rising US-China tensions, and instead focus on a new 1 trillion euro stimulus package across the Pond. The lasting move above the 200-day moving average would be for starters only, as I expect stocks to slowly grind higher overall despite the high likelihood of sideways-to-slightly-down trading over the summer. But before that, the ball remains in the bulls' court.
If you enjoyed the above analysis and would like to receive daily premium follow-ups, we encourage you to sign up for our Stock Trading Alerts to also benefit from the trading action we describe - the moment it happens. The full analysis includes more details about our current positions and levels to watch before deciding to open any new ones or where to close existing ones.
Thank you.
Monica Kingsley
Stock Trading Strategist
Sunshine Profits: Analysis. Care. Profits. -
The Bulls Took Over the Reins, Again
May 25, 2020, 7:17 AMStocks versus key resistances - that' how much of last week's trading could be characterized. Yet the bullish bias has been easily noticeable as prices kept making higher highs and higher lows on a daily basis. As a cherry on Friday's trading cake, the S&P 500 predictably shook off the Hong Kong-driven rise in US-China tensions. Will stocks confirm our analysis and break above the upper border of March's gap and the 61.8% Fibonacci retracement shortly?
Judging by the case we lay out next, it's probable.
S&P 500 in the Medium- and Short-Run
We'll start this week's flagship Stock Trading Alert with the weekly chart (charts courtesy of http://stockcharts.com ):

After last week's attempt to reverse to the downside, stocks continued to reject lower prices in Monday's premarket session, resulting in a bullish opening gap. And the S&P 500 hasn't really looked back since, moving two steps ahead, one step backwards throughout the week.
Knocking on the two key resistances reinforcing each other, it still managed to overcome the lower one, the 61.8% Fibonacci retracement. For how long will the upper one, the early March bearish gap stand?
While the weekly volume was largely neutral in its implications, the indicators don't stand in the way of further gains - but as they're not trending strongly either, we'll have to look for more clues on the daily chart.

The daily chart clearly shows stocks cutting into the combined resistance posed by the early March gap and the 61.8% Fibonacci retracement. Friday's upswing means that the index finished the week back above the latter one.
This is what we've written in our Friday's Alert:
(...) this week's daily downswings were only able to achieve higher lows. It means that it's two steps forward, one step backwards for the stock bulls.
Apart from the Hong Kong jitters, there hasn't been any other catalyst or development that would prompt the markets to reassess the risks. While it's true that there needn't be a catalyst, the overnight move lower appears of limited shelf life. Flash in the pan, in other words. The chart posture remains bullish, and we see it likely that the buyers would take on the 200-day moving average (that's around 3000) before too long.
Yesterday's volume doesn't mark a reversal either, and the daily indicators keep supporting the unfolding upleg. When will more buyers jump onboard? Once they do, we expect FOMO (fear of missing out) to become dominant over the wait-and-see approach of this extended consolidation.
Yes, it proved to be a consolidation, because no matter how bearish or bullish the indications for a move either way, stocks kept frustrating both the buyers and sellers equally. As a rollover to the downside never came, the chart pressure to move higher keeps building with each passing day and week, in our opinion.
Friday's higher close happened on lower volume, and didn't affect the daily indicators greatly. Regardless, price risks continue being skewed to the upside.
Would the credit markets confirm our bullish take on stocks?
The Credit Markets' Point of View

High yield corporate debt (HYG ETF) moved higher yesterday, but the daily volume is no reason to celebrate. Consolidation of recent sharp gains wouldn't come as a surprise, but this leading metric of credit market health is still primed to go higher and serve as a tailwind for stocks.

The moves in stocks and the high yield corporate bonds to short-term Treasuries ratio (HYG:SHY) continue to be moving in lockstep. Crucially for the stock bulls, this gauge of bullish spirits remains on their side.

The same can be said about the ratio of investment grade corporate bonds to long-dated Treasuries (LQD:IEI). There is no divergence when compared to the previous HYG:SHY ratio.

The ratio of stocks to Treasuries, the S&P 500 to 10-year Treasuries ratio (SPX:UST), paints the struggle of stocks to break higher. As it continues to trade within sight of recent highs amid still bullish indicators, it favors another S&P 500 upswing.
Key S&P 500 Sectors and Ratios in Focus
These were the thoughts we posted in the intraday Stock Trading Alert less than two hours before Friday's session close:
(...) While the S&P 500 didn't make much progress so far, it's the performance of high yield corporate bonds that supports more gains downs the road - and it doesn't all that much matter whether they come still today, or whether stocks catch up vigorously during Monday's premarket session / just thereafter.
The key development among the heavyweight sectors (tech, healthcare and financials) is that they're refusing to budge and decline today.
Let's examine their performance looking at the closing prices.

Indeed, technology (XLK ETF) refused to move lower, validating our earlier thoughts. It appears that a shallow correction is all there has been to it, and that the uptrend can go on and close the late February gap as it would challenge the February highs next.

Healthcare (XLV ETF) also refused to sell off any deeper. Given the swing structure seen, we expect the sector to eventually break higher from its sideways trading range.

While the HYG ETF closed higher on Friday, financials (XLF ETF) merely refused to decline. Given the posture of the daily indicators and the low volume of Friday's trading, that's no cause for concern - while more sideways trading can go on in the short term, the sector remains likely to challenge its April highs and overcome them.
Once again, consumer discretionaries (XLY ETF) refused to move lower while the consumer staples (XLP ETF) slightly gained. However, the consumer discretionaries to staples ratio (XLY:XLP) continues to trade within spitting distance to its recent highs. These were our Thursday's thoughts about the move's importance as the ratio:
(...) is already trading well above its February highs. Given the degree of real economy destruction seen around, that's quite a signal this leading indicator is sending. The financials to utilities ratio (XLF:XLU) looks to have stabilized not too far from the declining resistance line connecting its mid-March and early-May intraday tops, and it's our opinion that it would go on to break higher.
The XLF:XLU ratio erased its intraday decline on Friday, and continues to trade sideways for now. While it didn't break above the declining resistance line yet, we expect it to overcome it eventually.
As for the stealth bull market trio, all three - energy (XLE ETF), materials (XLB ETF) and industrials (XLI ETF) - refused to decline any more intraday. And the sellers weren't really on the trading floor as it didn't take much buying power to rebuff the meek attempt. While that's a bullish sign in general, let's explore specifically sector-by-sector.

Looking at the closing prices only, energy suffered a daily setback. But it is far from rolling over to the downside, and we expect it to keep on consolidating with a bullish bias.

The materials' chart is in a stronger technical posture, having come closer to its all-time highs, and having closed the early March gap already. It certainly appears more gains are on the horizon - especially considering the low volume of Friday's downswing.

It's also among the industrials that we see base building for an eventual launch higher. Yes, that's keeps being true despite the lower low made recently in this sector, or retesting it in materials - an overshoot can come before the market moves in its true direction. And just as with the S&P 500 breaking below the 50% Fibonacci retracement not too long ago, we see that in the stealth bull trio too.
Summary
Summing up, Thursday's decline didn't land in good company of Friday as stocks refused to decline, and actually reverted back above the 61.8% Fibonacci retracement. Another attempt to close the early March gap is supported by the daily indicators, and we expect stocks to break above both formidable resistances on a lasting basis. Both the credit market and sectoral strength examination favor this conclusion. Thereafter, the bulls would target the 200-day moving average at around 3000. That's for starters, as we expect to slowly grind higher overall despite the high likelihood of sideways-to-slightly-down trading over the summer. But before that, the ball remains in the bulls' court.
If you enjoyed the above analysis and would like to receive daily premium follow-ups, we encourage you to sign up for our Stock Trading Alerts to also benefit from the trading action we describe - the moment it happens. The full analysis includes more details about our current positions and levels to watch before deciding to open any new ones or where to close existing ones.
Thank you.
Monica Kingsley
Stock Trading Strategist
Sunshine Profits - Effective Investments through Diligence and Care
Free Gold &
Stock Market Newsletter
with details not available
to 99% investors
+ 7 days of Gold Alerts
Gold Alerts
More-
Status
New 2024 Lows in Miners, New Highs in The USD Index
January 17, 2024, 12:19 PM -
Status
Soaring USD is SO Unsurprising – And SO Full of Implications
January 16, 2024, 8:40 AM -
Status
Rare Opportunity in Rare Earth Minerals?
January 15, 2024, 2:06 PM

