

-
Just Who Would Trust Yesterday's Stock Upswing?
May 15, 2020, 8:26 AMJust when it appeared that the bears will get a third consecutive daily close lower, stocks rebounded from the 50% Fibonacci retracement. Having stabilized and adding to the intraday gains within the final hour before the closing bell, have the sellers been banished now?
That's unlikely in our view.
S&P 500 in the Short-Run
Let's start with the daily chart perspective (charts courtesy of http://stockcharts.com ):
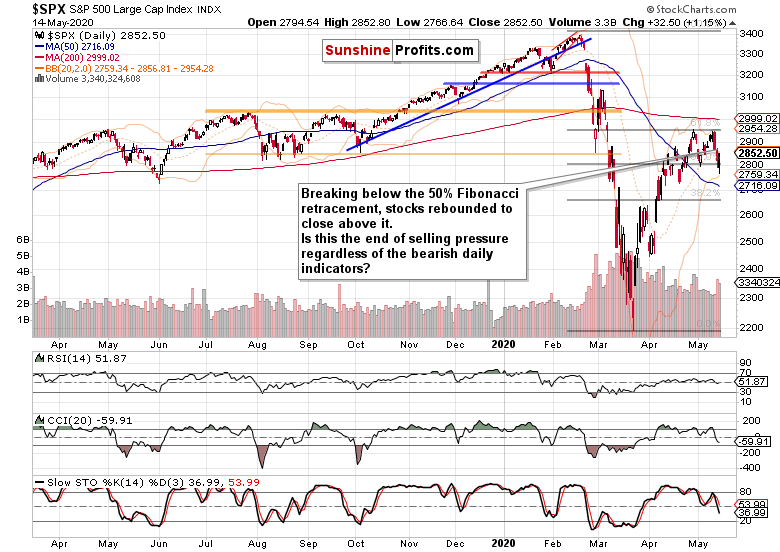
Stocks opened with a bearish gap, going deeper below the 50% Fibonacci retracement. The bulls stepped in though, striving to repair the daily price damage.
This is how we have summarized their efforts some 75 minutes before the closing bell in our latest intraday Stock Trading Alert that day:
(...) The stock bulls continued to push higher, while the corporate junk bonds didn't confirm the stock advance to such a degree. So, where are the stock advance engines and are they likely to go on firing?
Healthcare (XLV ETF), financials (XLF ETF) and consumer discretionaries (XLY ETF) are among the best performing sectors today - but still, they have only retraced certain parts of their yesterday's downswing. Technology (XLK ETF) hasn't managed to do that (Amazon, Microsoft, Apple and Alphabet are not today's shining stars) while the stealth bull trio (energy, materials and industrials) continue lagging behind in their retracing attempts too.
But the stock index is still attempting to move higher, regardless of not having the key upswing drivers aligned behind the attempt. Smallcaps (IWM ETF) are also performing less than strongly, trading with a sizable upper knot and well below yesterday's closing prices. This subtly points to the bear takedown risks being still very much present in the market.
Okay, these are the clues for the 500-strong index. But we are trading the index and have to respect its swing structure with the potential overshoots. And it tells us that should stocks (driven by the tech comeback later today) play catch-up and take prices above 2870, the risk of further gains in the lead up to tomorrow's retail data would be there. That's true regardless of the incoming data likely to be worthy of a horror show, and the market selling off in its wake.
The mentioned trio (healthcare, financials and consumer discretionaries) have indeed added to their intraday gains in the final hour of trading - during which neither technology (XLK ETF) nor smallcaps (IWM ETF) have exactly outshined them.
Tellingly, our overnight target of 2870 that would have the power to flip the very short-term outlook bullish, hasn't been reached by a long shot. And as we see the futures having rolled over to trade at around 2820, we're getting a real-time confirmation of the yesterday-presented bearish outlook for stocks - both in the regular Stock Trading Alert and its intraday follow-ups.
On top, today's bearish plunge comes in anticipation of the upcoming retail sales figures, providing us with one more hint of which way stocks are likely to trade after the US market open. In short, expect the bears to reappear.
How did the credit markets perform during yesterday's session exactly?
The Credit Markets' Point of View
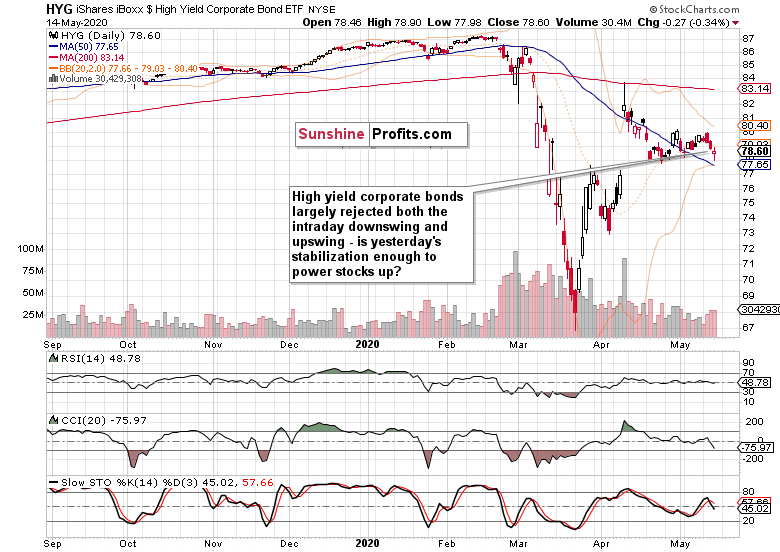
While high yield corporate debt (HYG ETF) refused to go much lower or higher since yesterday's open, it's relative stabilization on a daily basis seems to have ignited stocks more than justified. A bridge too far for the stock bulls? Looking at the shape of things, probably.
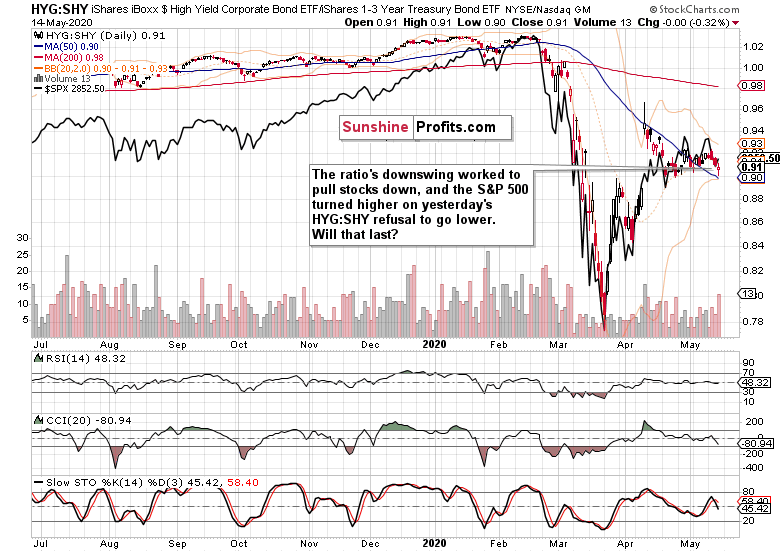
The high yield corporate bonds to short-term Treasuries ratio (HYG:SHY) also hints at the prevailing bearish overtones. This ratio too is well positioned to exert downside pressure on the overlaid S&P 500 chart (the black line).
Key S&P 500 Sectors and Ratios in Focus
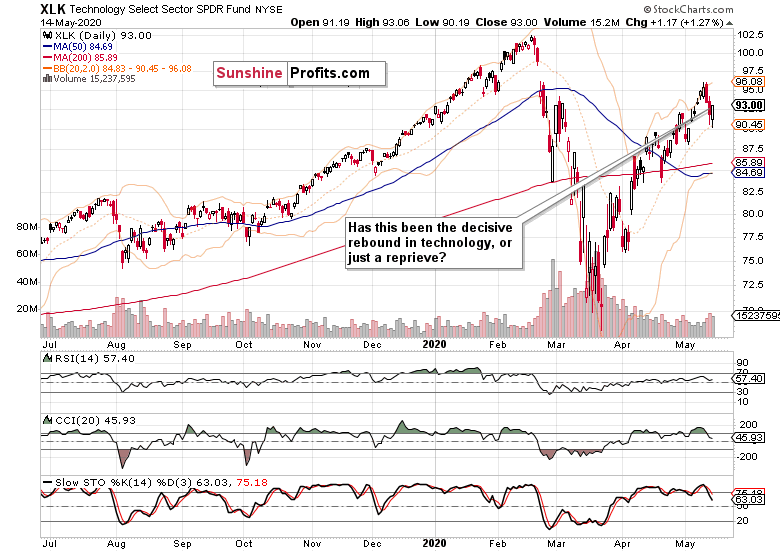
Technology's volume on the upswing didn't match or overcome that of the preceding downswing. Is the sector likely to catch up with more upside price action later today? Judged by the daily indicators, that's unlikely.
The prospect of bearish upcoming performance in the short-term will serve to put pressure on the whole index - just as the performance of the stealth bull market trio will, and healthcare (XLV ETF), consumer discretionaries (XLY ETF) or financials (XLF ETF) can't be counted on to save the S&P 500's day.
Materials (XLB ETF) were the strongest ones yesterday, with energy (XLE ETF) and industrials (XLI ETF) lagging behind the attempts to retrace Wednesday's declines. This doesn't bode well for the the index as such, and their upcoming opening prices and performance later in the day would likely confirm that.
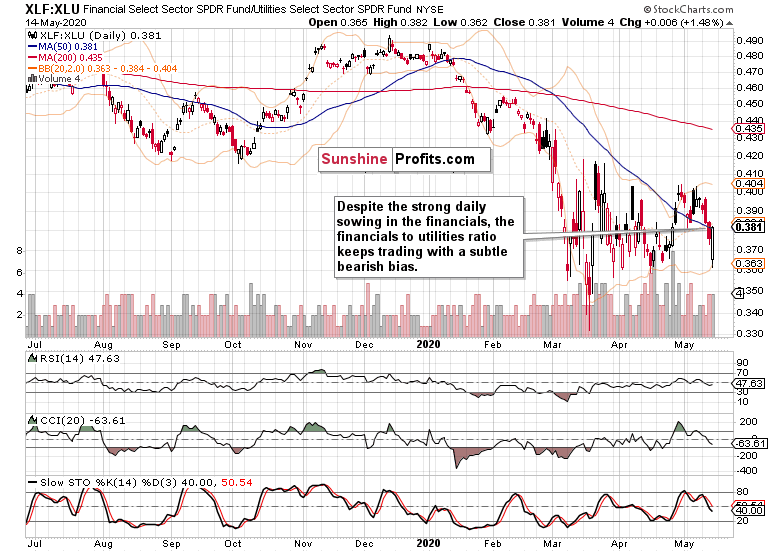
Yes, financials scored an upswing yesterday, but that didn't flip the financials to utilities ratio (XLF:XLU) over to bullish. Coupled with its daily indicators' posture, this leading ratio maintains its bearish short-term outlook.
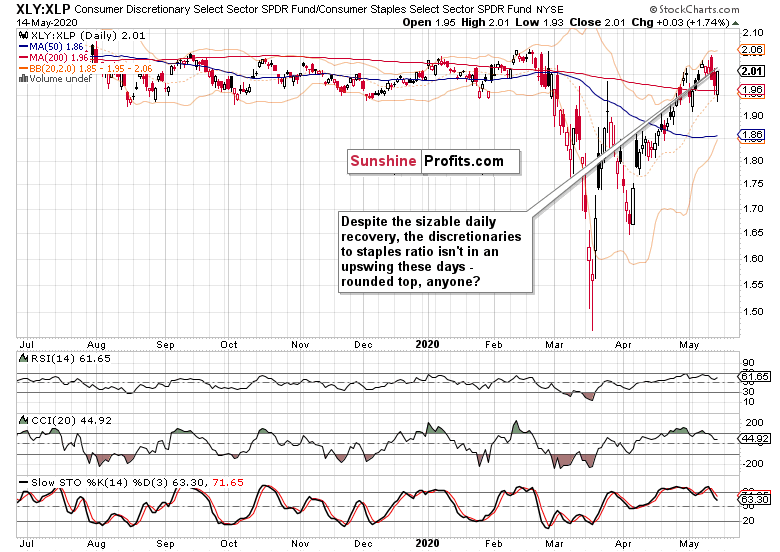
And so does the consumer discretionaries to consumer staples ratio (XLY:XLP). After retracing all the downswing since its February highs, this leading metric appears to be rolling over to the downside.
And we fully expect the upcoming retail data to put pressure on yesterday's star performers, the discretionaries (XLY ETF). There is no other logical conclusion to be made as the V-shaped recovery is increasingly being recognized by the market place for what it truly is - a pipe dream.
From the Readers' Mailbag
Q: the S&P is showing strong support at the 2720 range where you have put the target. However the Dow shows support at 23100 (which was breached today). How do you know which one to go by?
A: Yes, the 2720 area is a meaningful S&P 500 support zone as both the 50-day moving average and the late April lows are located there. The other indices such as Dow Jones Industrial Average or Russell 2000 give us valuable clues, but foremost, we have to focus on the S&P 500 itself.
Applied to the current situation, we see that DJIA rebound yesterday mirrored that of the S&P 500 - also in terms of volume relative to the preceding daily downswing. In latter stages of stock advances (and as the repeated showing at the 61.8% Fibonacci retracement shows, we think that's a true description of the S&P 500 status), it's not unusual to see broader-based indices (S&P 500) hold up ground better than the narrower ones (DJIA).
As for smallcaps though, that's a different story. The Russell 2000 (IWM ETF) hasn't performed as strongly as the S&P 500 did on the rebound (i.e. the backbone of US economy hasn't been confirming the advance by leading higher relatively), which is yet another bearish piece to the puzzle. And odds are the unfolding puzzle will be resolved with another downswing before too long.
Summary
Summing up, despite the bullish finish to yesterday's trading, the buyers don't appear to be as strong as they project themselves to be. Unless we see a turnaround in the credit markets and renewed vigor among the formerly leading S&P 500 sectors and their ratios, Thursday's session is likely to mark a temporary reprieve only. Should the HYG ETF break below the late April lows, the bearish case would get a new lease of life. Combining the technical and fundamental developments (the increased reflection of serious downside risks and overly rose-tinted glasses of the reopening and V-shaped recovery saga), the sellers are holding the upper hand currently. Our profitable open short position remains amply justified as stocks are likely to break down below the 50% Fibonacci retracement. The increasing US-China trade deal tensions only serve to add fuel to the fire - S&P 500 downswing catalyst.
If you enjoyed the above analysis and would like to receive daily premium follow-ups, we encourage you to sign up for our Stock Trading Alerts to also benefit from the trading action we describe - the moment it happens. The full analysis includes more details about our current positions and levels to watch before deciding to open any new ones or where to close existing ones.
Thank you.
Monica Kingsley
Stock Trading Strategist
Sunshine Profits - Effective Investments through Diligence and Care -
Has the Stock Downswing Started in Earnest?
May 14, 2020, 9:22 AMIt turned out that the late Tuesday Kaplan and Kashkari pronouncements were an opening act in yesterday's Powell appearance. Fed Chair's realistic and grim assessment just served to put pressure to throw yet another lifeline to the real economy. While this is far from the last Fed's word, the bulls didn't really find anything to cheer. How good and timely that we've issued an intraday Alert to jump in immediately onto the short side of the market to take advantage of the just unfolding slide! As the Congress is split on the Democrat-proposed $3T bill, how far can it go on?
S&P 500 in the Short-Run
Let's start with the daily chart perspective (charts courtesy of http://stockcharts.com ):
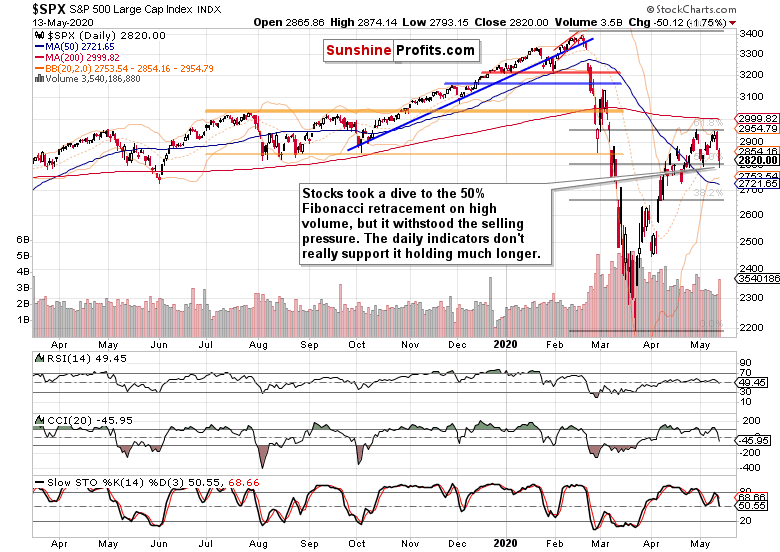
Despite some encouraging signs of overnight stabilization, stocks gave up the gains just as the Powell speech went on. Diving on heavy volume, the 50% Fibonacci retracement provided support to the buyers yesterday. Given the sell signals of the daily indicators, we're of the opinion that this support won't likely hold for too long.
This is how we have summarized it in our yesterday's intraday Stock Trading Alert:
(...) After the back-and-forth trading of recent weeks and all the signals favoring either the bulls or the bears at different junctures, the prevailing direction appears to be down now.
Powell delivered his own version of the Fed has given its best shot and coupled it with a call for more fiscal action. The point that the markets focused on the most, appears to be that despite the swift response and pledge to do more (while ruling out negative interest rates), it's the admittance of serious downside risks to the real economy and the fragile nature of the much-hyped recovery.
Both stocks and junk corporate bonds gave up on their efforts to reverse the preceding downswings, and stocks as the more vulnerable ones are leading on the way down. After all, should some of the reopening efforts backfire, what state of confidence would that leave the consumers and companies 6 or 8 weeks from now? The valuations would be even more extended than they have been already.
Thus, more twisting of the policymakers' arms rules the day, and given the credit markets - S&P 500 sectors dynamics, won't likely end all that soon.
Coupled with the Fauci testimony, second wave outbreaks around the world and outside the State of New York clusters of domestic infections, those were no good news for the bulls. It appears that similarly to the runup to the coronavirus plunge during February, stocks are first slowly, then more quickly coming to realization of the serious downside risks. Back then, the credit markets were showing non-confirmation of the stock advance to the all-time highs almost on a daily basis - eventually resolving with a slide, and the rest is history, as they say.
How do the credit markets look after yesterday's session exactly?
The Credit Markets' Point of View
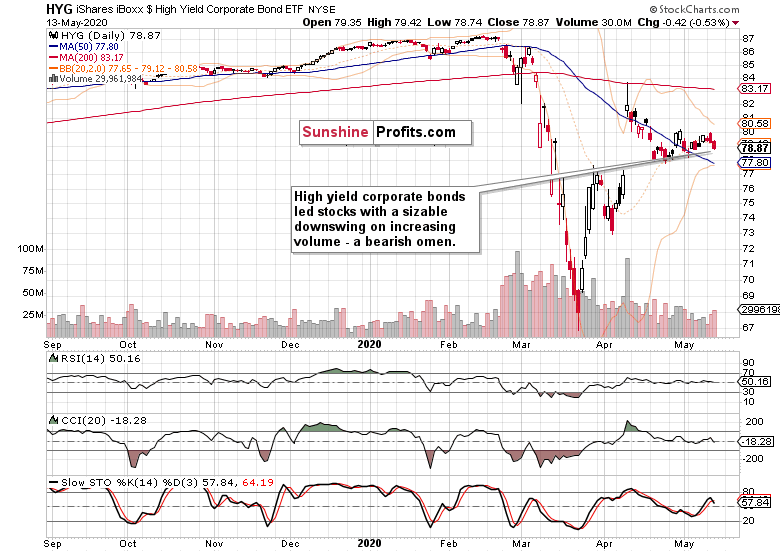
High yield corporate debt (HYG ETF) went slowly but surely deeper into the red as the session progressed. The sizable volume behind the two-day downswing is a warning sign, pointing to more downside ahead. Selling into the Fed's hands on the acknowledged tough times ahead, anyone?
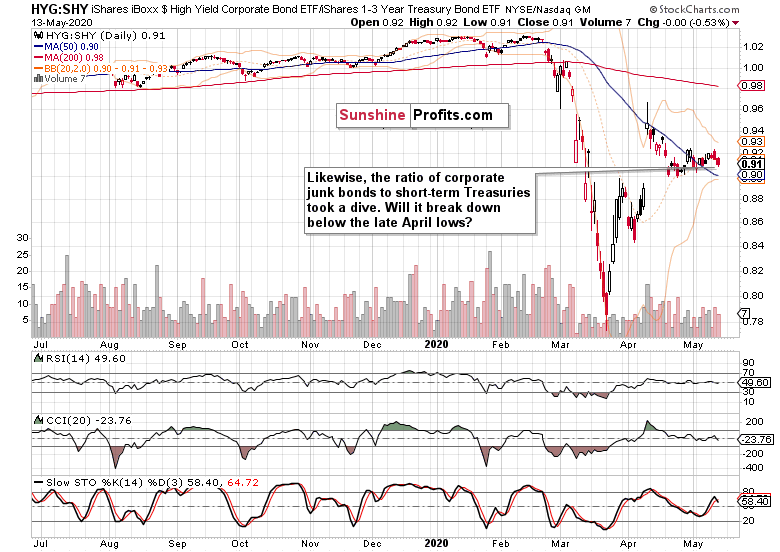
Importantly, the junk bond ratio to short-dated Treasuries (HYG:SHY) confirms the above assessment. As the next likely step, the challenge of late April lows looms - and for the HYG ETF as well.
Key S&P 500 Sectors in Focus
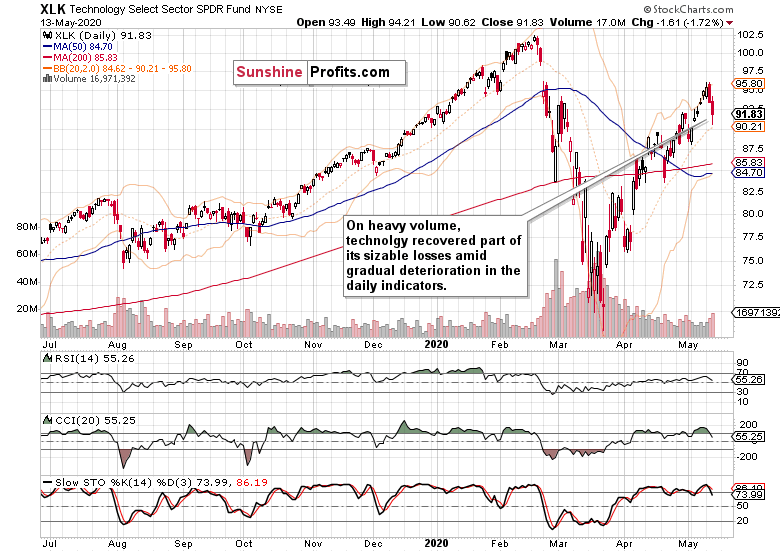
Technology declined on heavy volume, but retraced a part of the move lower. The daily indicators though wouldn't agree that a local bottom is in. As a result, we expect more downside action over the coming sessions, which is supported by volume picking up on the downside.
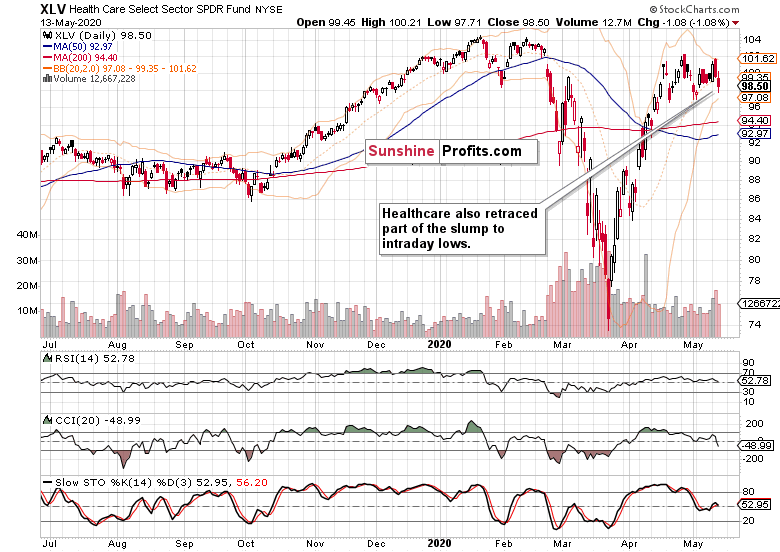
The healthcare (XLV ETF) bulls didn't step in as strongly before the closing bell, and yesterday's volume wasn't as large as in case of tech, relatively speaking. But these are the two most resilient sectors that have been performing strongest in the race off the March 23 lows - and still, their current price action leans bearish.
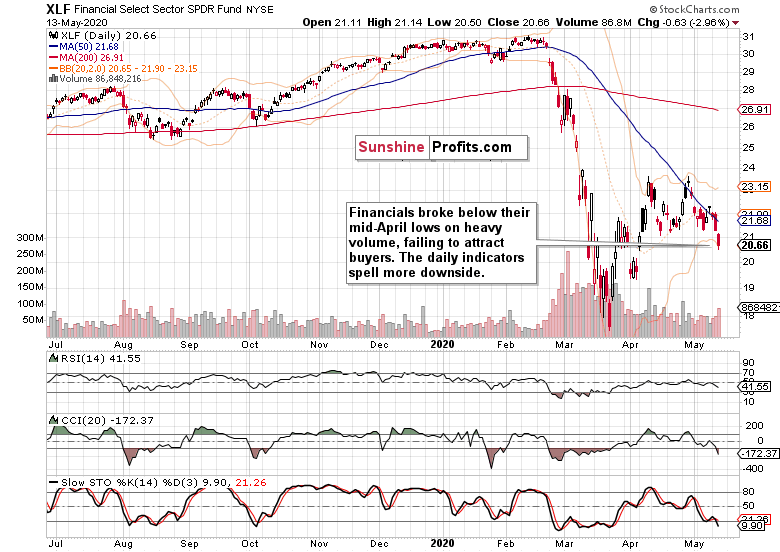
Out of the heavyweight, finance (XLF ETF) has been the weakest - both yesterday and since March 23. With buyers nowhere to be seen and the daily indicators as bearish as they get, downswing continuation is the path of least resistance here.
The early bull market sectors (energy, materials, industrials) also took a beating on high volume yesterday. Industrials (XLI ETF) are the weakest among them, already trading below their late-April lows. The bearish outlook they give (i.e. the bull market hypothesis being put to this heavy a test), is confirmed by the Russell 2000 (IWM ETF) downswing, again on high volume giving it credibility.
In closing, it appears that stocks won't shake of another several million new unemployment claims figure as gracefully as last week - and that's an understatement.
Summary
Summing up, the bullish case appears increasingly lost as stocks attempt to break below the 50% Fibonacci retracement. And given the momentum, credit markets' performance and sectoral dynamics, it's likely that the bears will succeed. Should the HYG ETF break below the late April lows, the bearish case would get a new lease of life. Combining the technical and fundamental developments though, the sellers are holding the upper hand currently regardless - the unfolding downswing is well placed to go on lower still. Our open and increasingly profitable short position remains justified.
If you enjoyed the above analysis and would like to receive daily premium follow-ups, we encourage you to sign up for our Stock Trading Alerts to also benefit from the trading action we describe - the moment it happens. The full analysis includes more details about our current positions and levels to watch before deciding to open any new ones or where to close existing ones.
Thank you.
Monica Kingsley
Stock Trading Strategist
Sunshine Profits - Effective Investments through Diligence and Care
Free Gold &
Stock Market Newsletter
with details not available
to 99% investors
+ 7 days of Gold Alerts
Gold Alerts
More-
Status
New 2024 Lows in Miners, New Highs in The USD Index
January 17, 2024, 12:19 PM -
Status
Soaring USD is SO Unsurprising – And SO Full of Implications
January 16, 2024, 8:40 AM -
Status
Rare Opportunity in Rare Earth Minerals?
January 15, 2024, 2:06 PM

