

-
The Anatomy of the Young Stock Market Bull
June 1, 2020, 3:53 AMAfter Thursday's late-day setback, stocks stabilized only to dip again in the runup to Trump's press conference - but what is the subsequent rebound made of? In today's flagship Stock Trading Alert, I'll examine the prospects of the bull run, and assess the bulls' strength. Can they power higher still?
S&P 500 in the Medium- and Short-Run
The month of May is over, so let's start with the monthly chart perspective (charts courtesy of http://stockcharts.com ):

Quite a sharp rebound from an even sharper plunge - that would be a fitting first impression. After breaking below the lower border of the rising blue trend channel, stocks reverted to trade solidly back inside. Having reached the midpoint of the channel amid improving monthly indicators, can we look forward for more gains ahead?

The weekly chart shows bullish price action that overcame another key resistance - the early March gap (shown in detail on the below daily chart). Breaching also the 50-week moving average, stocks have tested the lower border of the rising medium-term channel that they broke down from earlier.
While the weekly indicators are extended, they're not overly extended. Neither the volume reveals increasing involvement of the sellers. When will they show up to wage a decisive battle for lower prices?

The daily chart shows that we've seen the first shot on Friday. On sizable volume, the bulls regained the initiative. Has there been a particular driver of the intraday downswing?
Let's recall Friday's Stock Trading Alert:
(...) Trump will focus on China. When the latter has been announced, it marked the start of the heavy S&P 500 selling 45 minutes before the closing bell (on Thursday). As tensions have been rising, the short-term direction in stocks very much depends on the overall balance of President's announcement as regards Hong Kong, the Uyghur bill, coronavirus, the China-India border and foremost the trade deal.
Little wonder that stocks have been jittery. How did the drama end?
Let's quote the late-Friday's intraday Stock Trading Alert:
(...) stocks have weakened in the runup to the Trump press conference. Right after the first preliminary soundbites (notably the one that the Phase 1 China trade deal is on), stocks reversed intraday losses, and the HYG ETF moved close to its recent highs.
In other words, the prospects for the stock market upswing to reassert itself are intact.
Such were the key fundamental events late last week. But before moving over to the credit markets' perspective, let's dig some more into the daily chart's technicals.
Last week, stocks overcame both the early March gap and the 200-day moving average. The next objective for the bulls would be the early March highs at 3137. Can they make it there before the extended daily indicators call for a breather? While that's possible and appears to be a question of time, I wouldn't necessarily bet the farm on that.
After all, we've seen two intraday reversals (on Wednesday and on Friday). The odds continue favoring the bulls but a quick, out of the blue test of their resolve before the next upleg isn't out of the question.

Market breadth indicators underscore the setback suffered late last week. Despite being solidly in a bull market environment as the bullish percent index shows, both the advance-decline line and advance-decline volume have retreated. On one hand, that's to the territory where their next upturns started, on the other hand, should stocks struggle in the near term, these two indicators could form negative divergencies over the coming sessions.
Now, would the credit markets support the softly cautious, yet still bullish tone?
The Credit Markets' Point of View

High yield corporate bonds (HYG ETF) still fully confirm the stock market upswing. Marching in lockstep higher, the bond ETF hasn't suffered any intraday losses to speak of, and closed near the daily highs. The strong uptrend remains intact, providing tailwind for stocks.

The chart of the high yield corporate bonds to short-term Treasuries ratio (HYG:SHY) with the overlaid S&P 500 prices (black line), also continues supporting the stock bull run.

Both the index itself, and the S&P 500 to Treasuries ratio have overcome their April highs. As they're moving in sync, that's conducive for the stock bull run to go on.

Examination of the 10-year Treasury yields confirms this conclusion. Should the yields spike to the downside, that would be a huge warning sign for stocks. But we're not in a flight to safety that would send yields plunging, bidding Treasuries higher as investors seek refuge.
The sideways trend doesn't really stand in the way of further stock gains. Conversely, should we see yields rise, that would send a clear signal that it's becoming broadly acknowledged the recovery (in stock prices too) is well underway.
But with all the Fed interventions, yields will have a really hard time rising - and keeping yields low is a key monetary policy tool employed that lits the TINA (there is no alternative) fuse, which this works to support stocks.
Key S&P 500 Sectors and Ratios in Focus

Technology (XLK ETF) continues leading higher, and both the shallow intraday losses on Friday and the subsequent rebound are giving strong hints that this run is very far from over. The sizable volume attests to that.
Within technology, semiconductors (XSD ETF) are performing strongly - they've already closed their late February bearish gap, while tech in merely on the verge of doing so. Semiconductors outperforming the behemoths is a risk-on sign, and works to lead stocks higher.

Healthcare (XLV ETF) is another star performer, and the upside breakout of the recent trading range that I have called for early on Friday, is underway now. The daily indicators are supportive of the unfolding upswing, and definitely have plenty of room to grow.

The price action in the financials (XLF ETF) also follows a bullish path. While their rebound off the March lows hasn't been as strong, they've made a solid progress in the last two weeks. Friday's breather didn't take them much lower during the day, and the daily indicators don't favor a sharp move lower. Conversely, the financials are likely to muddle through with a bullish bias over the coming weeks.
Over the last three sessions, both telecommunications (XTL ETF) and consumer discretionaries (XLY ETF) performed similarly strongly as technology did. These key S&P 500 sectors agree that higher stock prices are in our future.
It's only the leading ratios that haven't yet recovered from last week's setback. Both financials to utilities (XLF:XLU) and consumer discretionaries to staples (XLY:XLP) are pointing in the short-term direction of the amber light.
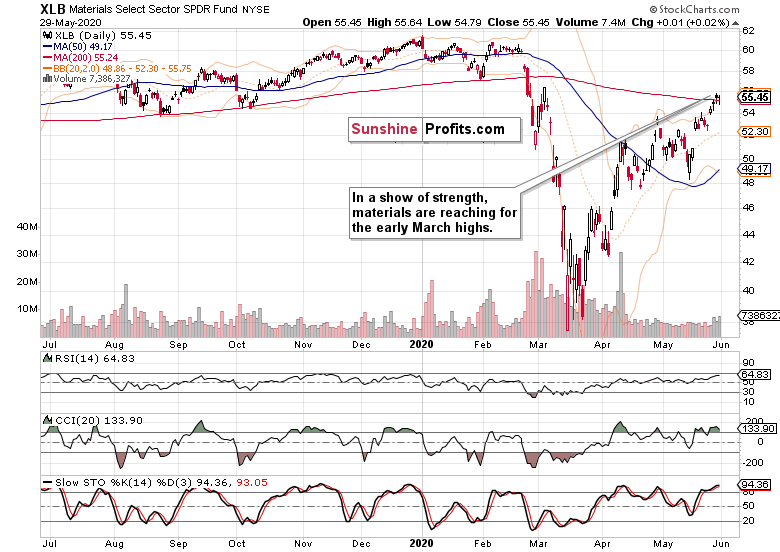
Positioned for more gains, materials (XLB ETF) have outperformed both energy (XLE ETF) and industrials (XLI ETF), leading the stealth stock bull market higher. One more argument for higher prices of materials, is the rangebound performance of the USD Index since late April.
Should the USDX really spike, that would be a meaningful fly in the ointment for many commodity prices. But after the March deflationary episode, the market is sensing inflation on the way, and that's already putting a floor below commodity prices. Remember, bonds peak first, then stocks, and finally commodities. And we haven't seen the peak in bonds yet, let alone in stocks.
Summary
Summing up, Thursday's late-day reversal was resolved with a no bombshell dropped by Trump during Friday's press conference. Stocks reversed higher after the first signs that the fears have been overblown. The week ended on a positive note, and the stock bull market remains intact. After closing the early March gap and overcoming the 200-day moving average, the next target for the buyers are the early March highs. While the credit market and sectoral analysis favor the stock upswing to go on, the continuing weak performance of the Russell 2000 (IWM ETF) is a short-term watchout, as it hasn't caught up as vigorously as the S&P 500 did on Friday. The balance of risks in the medium-term remains skewed to the upside, but I'm striking a bit cautious tone in the very short-term.
I still expect stocks to slowly grind higher overall despite the high likelihood of sideways-to-slightly-down trading over the summer - but we're nowhere near the start thereof. Right now, the breakout above the three key resistances (the 61.8% Fibonacci retracement, the upper border of the early March gap, and the 200-day moving average) is still unfolding with the bears running for cover and FOMO (fear of missing out) back in vogue. In short, the ball remains in the bulls' court to show us what they're made of. The weekly and monthly charts are also leaning in the bulls' favor.
If you enjoyed the above analysis and would like to receive daily premium follow-ups, we encourage you to sign up for our Stock Trading Alerts to also benefit from the trading action we describe - the moment it happens. The full analysis includes more details about our current positions and levels to watch before deciding to open any new ones or where to close existing ones.
Thank you.
Monica Kingsley
Stock Trading Strategist
Sunshine Profits: Analysis. Care. Profits. -
Two Steps Forward, One Step Backward in the S&P 500, Right?
May 29, 2020, 9:49 AMStocks defended the opening bullish gap, and scored further gains intraday before the sellers took over in the session's final 45 minutes. Have we seen a turning point?
In short, that's unlikely, and let me tell you why exactly I think so.
S&P 500 in the Short-Run
Let's start with the daily chart perspective (charts courtesy of http://stockcharts.com ):

The day looked like the bulls were firmly holding the reins, but another daily setback struck as we approached the closing bell. I say daily, because the volume didn't really overcome its recent highs, and stock prices haven't suffered a profound setback either. All that the bears were able to achieve, was pretty much reminiscent of the stock behavior during the unfolding breakout above the 61.8% Fibonacci retracement.
In other words, yesterday's setback isn't really a fly in the ointment for the bulls. The daily indicators keep supporting the bulls, with no imminent sell signals. The sky still remains clear for the buyers for now.
Yesterday's intraday Stock Trading Alert captures the key reason why:
(...) Against the backdrop of strengthening high yield corporate bonds (HYG ETF), the S&P 500 upswing has been progressing nicely throughout the day, and a local top in either seems to be very far away indeed.
While the sellers might try to close the week and month on a bearish note, the above words ring true also today because we haven't seen junk corporate bonds falling through the floor. Let's see precisely what I mean by that.
The Credit Markets' Point of View

High yield corporate bonds (HYG ETF) gave up all their gains since the market open, but the relatively low volume of the daily upswing rejection continues to favor the bulls. While it wouldn't come as a surprise to see a sharper consolidation of recent sharp gains, a running consolidation with higher highs and higher lows is all we've been getting so far. And that's a very bullish type of consolidation, boding well for the credit markets.
In short, the credit market uptrend is well established, and serves as a tailwind for stocks.

The chart of the high yield corporate bonds to short-term Treasuries ratio (HYG:SHY) with the overlaid S&P 500 prices (black line), also supports the view we haven't seen a game-changer yesterday.
Key S&P 500 Sectors and Ratios in Focus

While technology (XLK ETF) gave up its intraday gains, the swing structure of higher highs and higher lows, remains intact. And that's the definition of what an uptrend is. The sector simply appears to be trading sideways, consolidating recent sharp gains. Yesterday's lower volume versus the preceding higher one, sends a bullish message as buyers appear in droves when prices get lower.

Just as the tech sector, healthcare (XLV ETF) also supports the prospect of more gains to come. It's been knocking on the door of April and May highs, and an upside breakout of the recent trading range is only a matter of time in my opinion.

The price action in the financials (XLF ETF) also follows a bullish path. We've seen volume rise during last three sessions, and yesterday's session gives an impression of verification of the breakout above the April highs as the sector is consolidating recent gains.
The volume differential that favors the bulls is even more pronounced in the consumer discretionaries (XLY ETF). Real estate (XLRE ETF) for example, just extended its recent gains yesterday, disregarding the move lower in the index.
It has been only the leading ratios that suffered pronounced setbacks yesterday, as consumer discretionaries to staples (XLY:XLP) challenged their Wednesday's intraday lows, and financials to utilities (XLF:XLU) moved below them already. But we haven't seen what mathematicians would call an inflection point yet. In other words, it's likely we'll see both ratios stabilize and support the move higher in stocks next.
As for the stealth bull market trio, materials (XLB ETF) outperformed both energy (XLE ETF) and industrials (XLI ETF) as the latter two closed down - but again, on lower volume than during the preceding up days. Overall, this bull market trio still favors the stock upswing to continue.
Summary
Summing up, yesterday's late-day reversal didn't likely mark a call to start selling lock, stock and barrel everything in sight. Conversely, it appears to be a part of the ongoing consolidation that keeps resulting in higher highs and higher lows. As today is the last trading day of the week and month, the closing prices are of key importance for the timing of the anticipated challenge of the early March highs. While the credit market and sectoral analysis favor the stock upswing to continue, yesterday's weak performance of the Russell 2000 (IWM ETF) is a short-term watchout. The balance of risks is skewed to the upside over the coming weeks though.
I expect stocks to slowly grind higher overall despite the high likelihood of sideways-to-slightly-down trading over the summer - but we're nowhere near the start thereof. Right now, the breakout above the three key resistances (the 61.8% Fibonacci retracement, the upper border of the early March gap, and the 200-day moving average) is still unfolding with the bears running for cover and FOMO (fear of missing out) back in vogue. In short, the ball remains in the bulls' court to show us what they're made of. Will the weekly and monthly closing prices later today still lean in the bulls' favor on higher timeframes? I would cautiously say so.
Last but not least, we'll hear Powell speak later today, and Trump will focus on China. When the latter has been announced, it marked the start of the heavy S&P 500 selling 45 minutes before the closing bell yesterday. As tensions have been rising, the short-term direction in stocks very much depends on the overall balance of President's announcement as regards Hong Kong, the Uyghur bill, coronavirus, the China-India border and foremost the trade deal. We'll monitor and act accordingly on the unfolding developments.
If you enjoyed the above analysis and would like to receive daily premium follow-ups, we encourage you to sign up for our Stock Trading Alerts to also benefit from the trading action we describe - the moment it happens. The full analysis includes more details about our current positions and levels to watch before deciding to open any new ones or where to close existing ones.
Thank you.
Monica Kingsley
Stock Trading Strategist
Sunshine Profits: Analysis. Care. Profits. -
As Said, the S&P 500 Grind Higher Goes On
May 28, 2020, 9:30 AMYesterday's sizable bullish gap immediately came under attack by the sellers - no panicking though as I kept riding the bull to the glorious close and beyond. In such moments, it's key to focus on what has changed, and what has not. The obvious conclusion has been that we have seen nothing really new under the sun.
So, will the sizable open profits keep growing further? In my humble opinion, it's virtually guaranteed.
S&P 500 in the Short-Run
Let's start with the daily chart perspective (charts courtesy of http://stockcharts.com ):
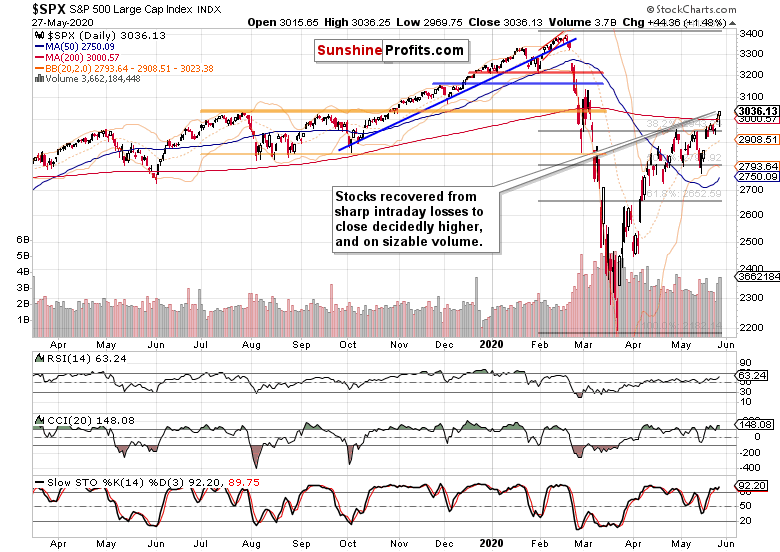
The bears went on the offensive right after the bullish open, but the bulls responded as anticipated, and the high daily volume reveals the extent of the buying pressure. Yes, the initiative appears to be firmly with the bulls, but why exactly have I said that the buyers responded as anticipated?
Yesterday's intraday Stock Trading Alert provides the answer:
(...) However unpleasant it might be to see the bullish opening gap closed, the key point to highlight is that the high yield corporate bonds (HYG ETF) hasn't really declined below yesterday's closing prices.
Such a move has been rejected, and the ETF now trades at $82 - and I expect stocks to at least timidly follow up higher later today, and more vigorously over the coming sessions.
What we have seen right after the open, was probably a US-China tensions driven onset of selling pressure - an event of fleeting nature as the ensuing price action showed.
And stocks caught up still yesterday, reversing powerfully higher. To illustrate the extent of the bullish turn, let's check the market breadth indicators.
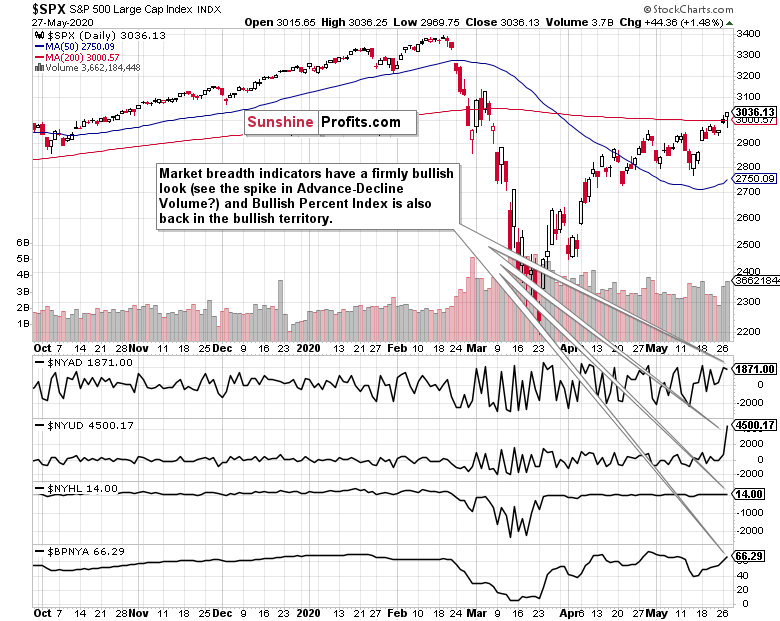
It hasn't been only the advance-decline volume that just flipped profoundly bullish. The advance-decline line has been showing where the odds in the battle to overcome the 61.8% Fibonacci retracement and other resistances lie - with the bulls. The bullish percent index is also solidly back supporting the buyers these days.
Let's check yesterday's action in the credit markets next.
The Credit Markets' Point of View
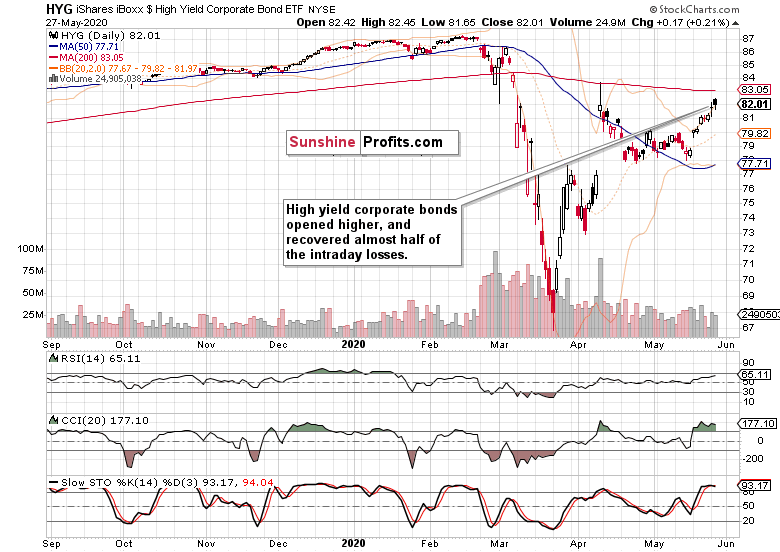
High yield corporate bonds (HYG ETF) stood the ground and refused to move below yesterday's closing prices. The uptrend in junk corporate bonds goes on, supporting higher stock prices. While a consolidation of recent sharp gains wouldn't come as a surprise, we could have seen one yesterday already. And even if not, this leading metric of credit market health is still primed to go higher and serve as a tailwind for stocks over the coming days and weeks.
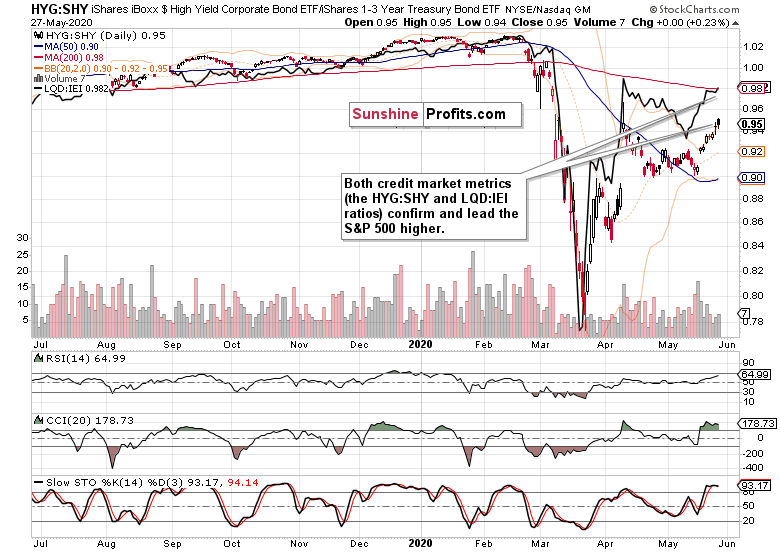
The above chart shows that both key credit market ratios, the high yield corporate bonds to short-term Treasuries (HYG:SHY) and the investment grade corporate bonds to longer-dated Treasuries (LQD:IEI), confirm each other's upswings. Such a lockstep move doesn't reveal any cracks in the stock market bull run.
Key S&P 500 Sectors and Ratios in Focus
Technology (XLK ETF) reversed all intraday losses, and rose on high volume yesterday. The sizable lower shadow underscores the buying interest, boding well for higher prices of the sectoral ETF. And as tech leads the stock market itself, the bullish takeaway is valid also for the S&P 500.
The intraday bullish reversal was mirrored in healthcare (XLV ETF) as well, supporting prospects of more gains to come. And the same goes for financials (XLF ETF) and consumer discretionaries (XLY ETF) too. The key sectors are aligned for more gains ahead, and quite likely shortly.
Among the leading ratios, financials to utilities (XLF:XLU) has indeed broken above the declining resistance line formed by its April highs (and also above those highs themselves) - just as I expected it to. The bullish picture is made complete by the consumer discretionaries to staples ratio (XLY:XLP) that has refused to turn south, and continues to trade within spitting distance of its recent highs.
As for the stealth bull market trio, all three - energy (XLE ETF), materials (XLB ETF) and industrials (XLI ETF) - refused to decline yesterday. That's a uniformly bullish sign, with the materials and industrials having led the move higher on the day.
Summary
Summing up, yesterday's selling didn't stick, and the buyers predictably took over the reins. Less and less in terms of resistances is standing in the bulls' way and the challenge of the early March highs is slowly but surely drawing nearer. Both the credit market and sectoral analysis favor this bullish takeaway. So does the Russell 2000 upswing as the smallcaps have reversed higher just as powerfully as the S&P 500 did.
I expect stocks to slowly grind higher overall despite the high likelihood of sideways-to-slightly-down trading over the summer - but we're nowhere near the start thereof. Right now, the breakout above the three key resistances (the 61.8% Fibonacci retracement, the upper border of the early March gap, and the 200-day moving average) is still unfolding with the bears running for cover and FOMO (fear of missing out) back in vogue. In short, the ball remains in the bulls' court.
Free Gold &
Stock Market Newsletter
with details not available
to 99% investors
+ 7 days of Gold Alerts
Gold Alerts
More-
Status
New 2024 Lows in Miners, New Highs in The USD Index
January 17, 2024, 12:19 PM -
Status
Soaring USD is SO Unsurprising – And SO Full of Implications
January 16, 2024, 8:40 AM -
Status
Rare Opportunity in Rare Earth Minerals?
January 15, 2024, 2:06 PM

