

-
The $64,000 Question – Are the Bears Just Getting Started?
October 15, 2020, 10:00 AMMeek and tame, the soft patch is here – at least according to the charts thus far. Will it stick being so, or are the bears readying a surprise? We're at that correction's stage where the bulls can still say enough is enough, and buy convincingly.
It's Thursday, and the weekly candle in progress has a noticeable upper knot already, and the volume is likely to surpass last week's one.
Ideally today or tomorrow, buying power should emerge to prevent further chart deterioration. How likely is that given the stimulus wrangling, European corona situation and lockdown fears?
Will my yesterday's words be proven right or wrong?
(…) Will it turn into a 10%+ correction, or worse? I highly doubt that. Can the digestion of sharp gains have a zigzag form (two waves down with one wave up in between)? It's possible, but it's still unlikely it would reach too far on the downside.
Yes, I look for a correction in time rather than in price. The Fed is slowly but surely stepping up to the plate, and the stimulus game of chicken is closer to its end than to its beginning. There is just simply too much going on in the rally's favor to derail it. Regardless of the declining put/call ratio, we're not in extreme greed – just your usual and not too elevated garden variety of it.
S&P 500 in the Short-Run
I’ll start with the daily chart perspective (charts courtesy of http://stockcharts.com ):

The move to the downside has accelerated a little yesterday, but volume didn't pick up. Also, the decline's pace is nowhere near its rate at the beginning of September, which is making these situations not similar.
The bull flag can still materialize over the coming days. With measured price moves and volatility as low as yesterday, this scenario has more chances of materializing than not.
Such were my yesterday's observations on the bears:
(…) Unless they start acting courageously, the correction won't get far. Seeing the opening shot in the charts, I am not looking for the consolidation to reach out really far to the downside.
The confluence of 50-day moving average and the Feb highs, isn't all that far though - the bulls better step in earlier so that the bull flag theory remains intact.
Credit Markets’ Point of View

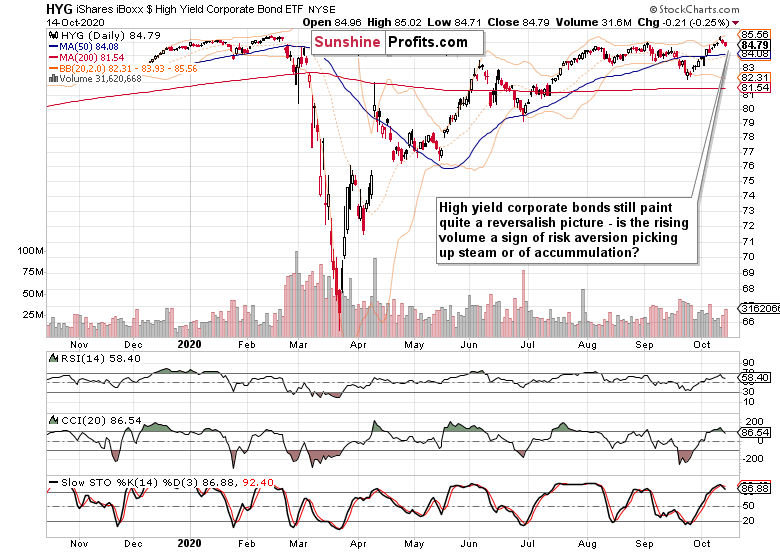
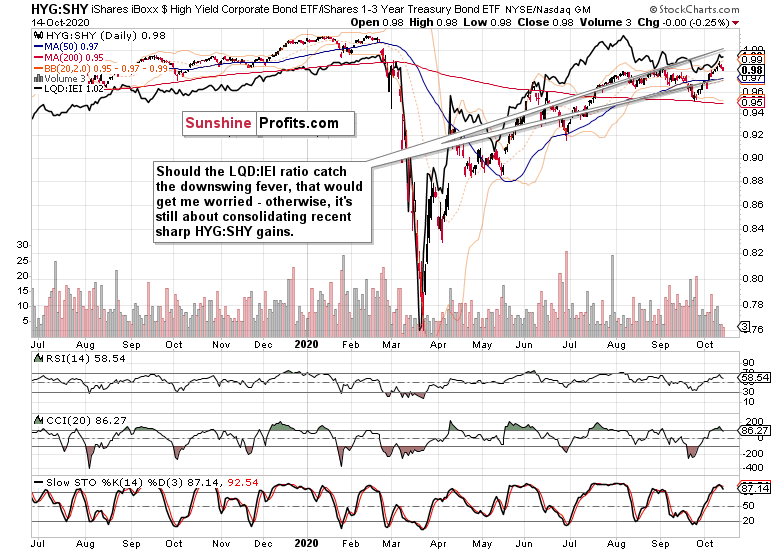
High yield corporate bonds (HYG ETF) keep being under pressure, and the volume examination isn't encouraging. I can't say yet it's a sign of accumulation – prices would have to reject the downswing e.g. by forming a long lower knot.

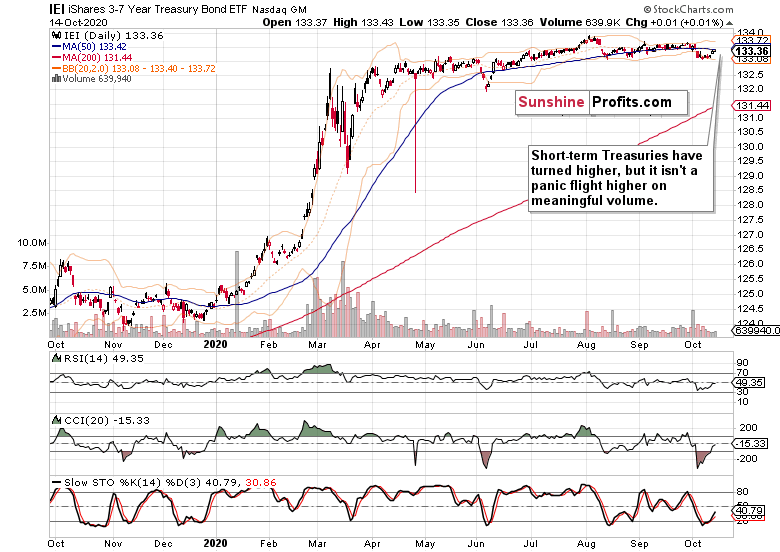
Medium-term Treasuries (IEI ETF) have recovered lately, but the swing structure doesn't attest to a flight to safety.

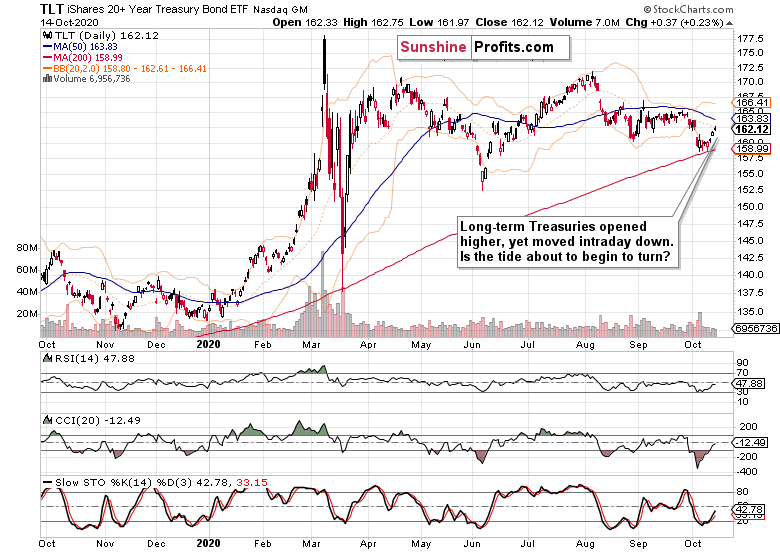
Similarly in long-term Treasuries (TLT ETF), there has not been any panic buying to speak of. These instruments even turned lower intraday, which is telling for the days to come. Perhaps not yet for today, but this upswing is at a lower high than it was in September.

Both leading credit market ratios – high yield corporate bonds to short-term Treasuries (HYG:SHY) and investment grade corporate bonds to longer-dated Treasuries (LQD:IEI) – are ticking lower, with the more risk-on one leading the way. Should LQD:IEI join in the decline with equal conviction as HYG:SHY, that would be worrying.
Market Breadth, Force Index and Bollinger Band Width

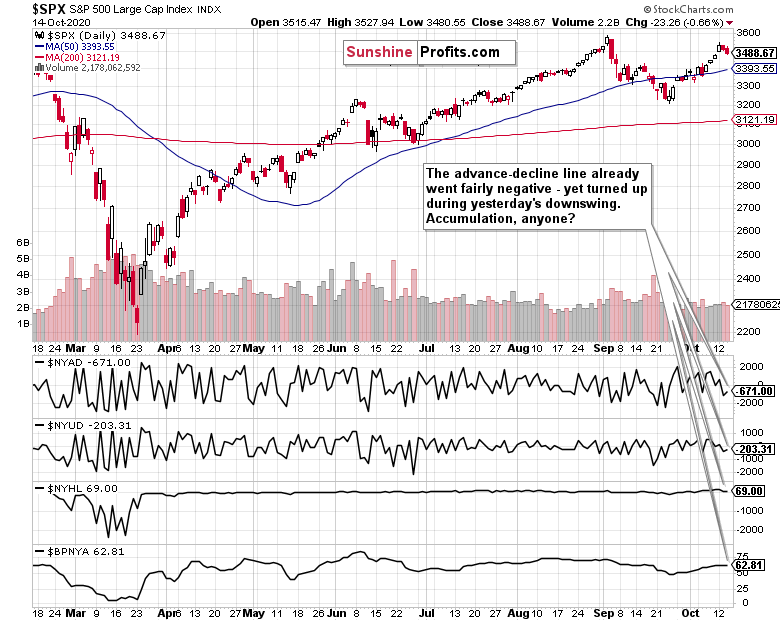
Despite yesterday's downswing, the advance-decline line has ticked higher. Much more obviously needs to happen, it's a gentle sign that the sellers weren't as strong yesterday.

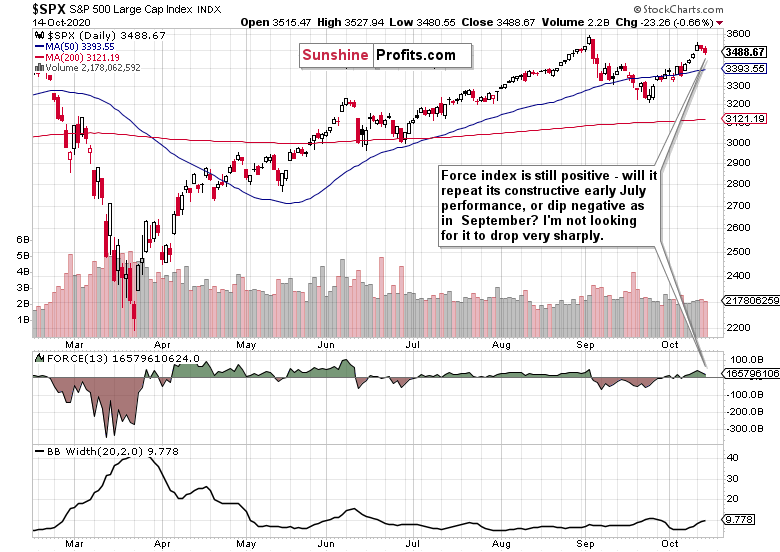
The Force index hasn't left the positive territory, and the question remains whether we would see it mostly keeping above the zero line, or whether a deeper plunge below it would happen – and last for a while. I don't think we would see September repeating.
Summary
Summing up, the soft patch is picking up some speed, and stocks are under pressure currently. Smallcaps though aren't taking a plunge, faster and on really higher volume. I'm keeping an eye on the credit markets for signs that this selling pressure is abating and that the bull flag remains intact. The coming sessions would be telling, and if commodities are anything to go by, then the stock downswing is likely to run into headwinds soon.
Thank you for reading today’s free analysis. If you would like to receive daily premium follow-ups, I encourage you to sign up for my Stock Trading Alerts to also benefit from the trading action described - the moment it happens. The full analysis includes more details about current positions and levels to watch before deciding to open any new ones or where to close existing ones.
Thank you.
Monica Kingsley
Stock Trading Strategist
Sunshine Profits: Analysis. Care. Profits. -
The S&P 500 Breather Is Here – Who Wants to Pick Pennies in Front of a Steamroller?
October 14, 2020, 9:30 AMYes, the soft patch I talked about earlier yesterday, is here – and it's still meek and tame. Will it turn into a 10%+ correction, or worse? I highly doubt that. Can the digestion of sharp gains have a zigzag form (two waves down with one wave up in between)? It's possible, but it's still unlikely it would reach too far on the downside.
Yes, I look for a correction in time rather than in price. The Fed is slowly but surely stepping up to the plate, and the stimulus game of chicken is closer to its end than to its beginning. There is just simply too much going on in the rally's favor to derail it. Regardless of the declining put/call ratio, we're not in extreme greed – just your usual and not too elevated garden variety of it.
Having said so, let me show you some of the key pieces of evidence. The great bull run is on, and will survive the elections easily – I don't see October storms as spirit-trying as September was.
S&P 500 in the Short-Run
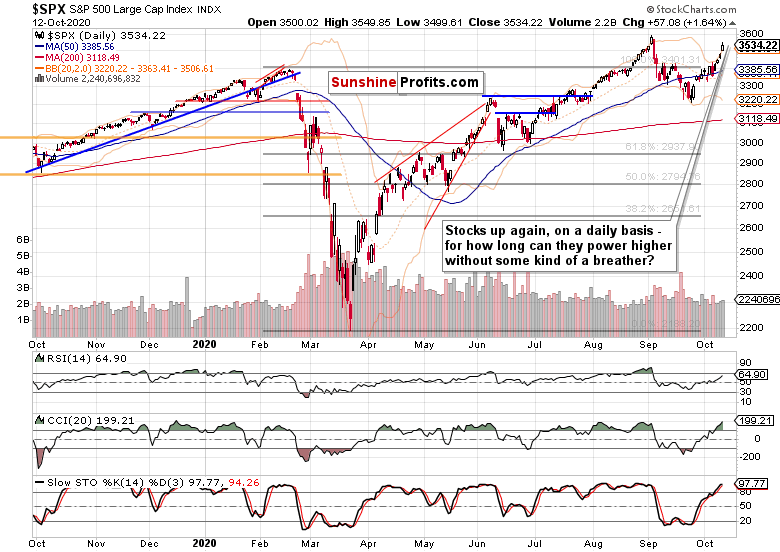
I’ll start with the daily chart perspective (charts courtesy of http://stockcharts.com ):

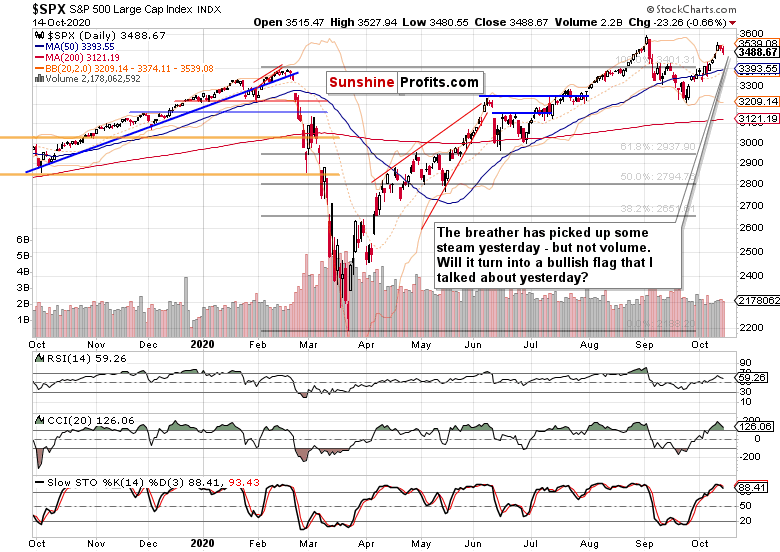
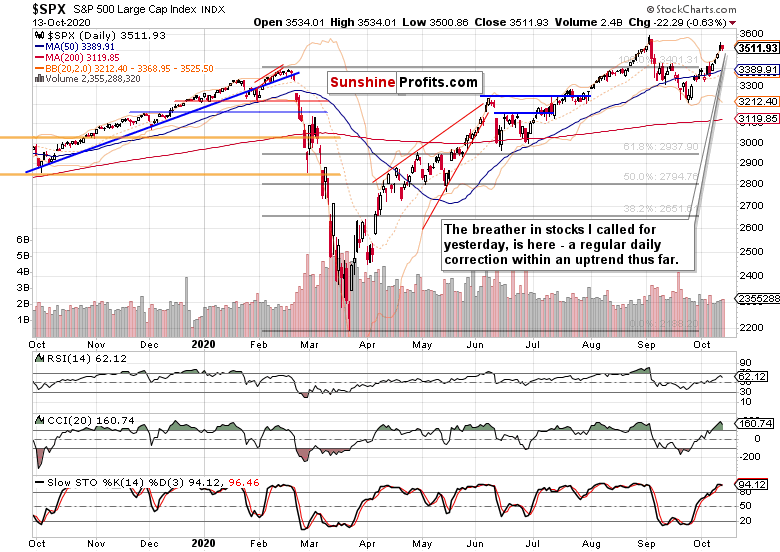
No tree grows to the sky – no matter the factors in its favor or the aura of invincibility, every trend has to pause from time to time. And yesterday's session was the first swallow of the soft patch I announced as likely to happen this week. Volume hasn't picked up, so the market concurs there is no reversal here.
Then, prices have retraced a portion of yesterday's tepid decline, which is what you would expect to see when the bears are timidly looking around in search of company. As in will you sell too?
Unless they start acting courageously, the correction won't get far. Seeing the opening shot in the charts, I am not looking for the consolidation to reach out really far to the downside.
Credit Markets’ Point of View

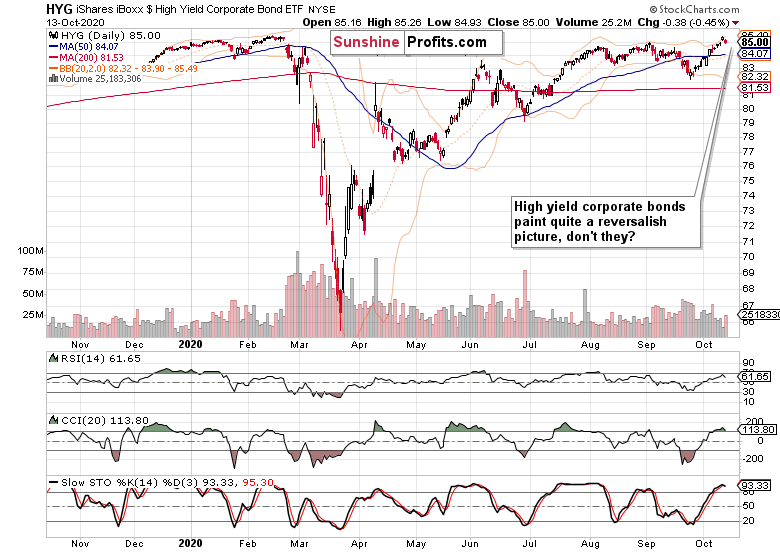
High yield corporate bonds (HYG ETF) are striking a more cautious tone – they have declined more profoundly than stocks did. Shall I take this sign at face value, i.e. stocks are in danger here?

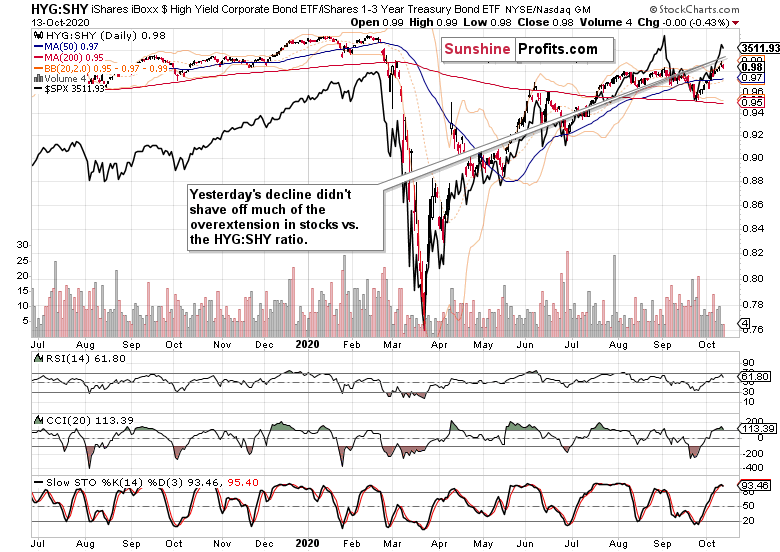
The ratio of high yield corporate bonds to short-term Treasuries (HYG:SHY) is still as extended as after Monday's session. S&P 500 is refusing to budge – no panic, no trigger, no collapsing under its own weight.

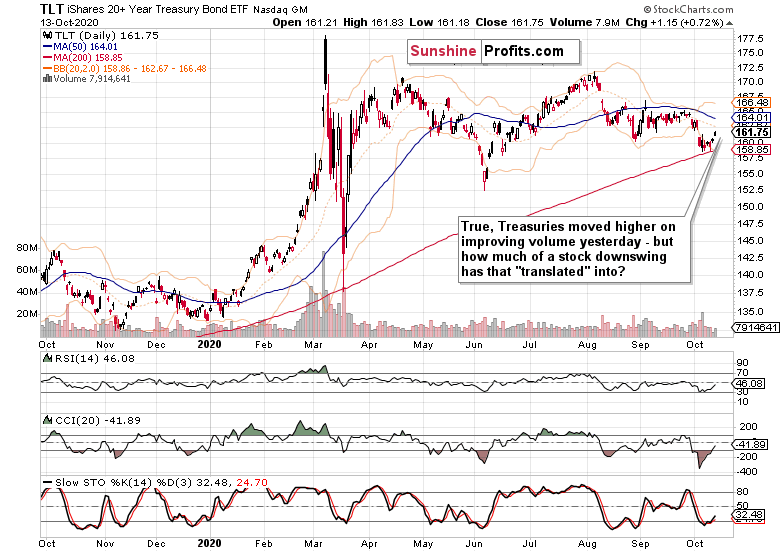
Long-term Treasuries (TLT ETF) are recovering, putting some pressure but does it have enough fuel in the tank according to this chart? I don't think so.

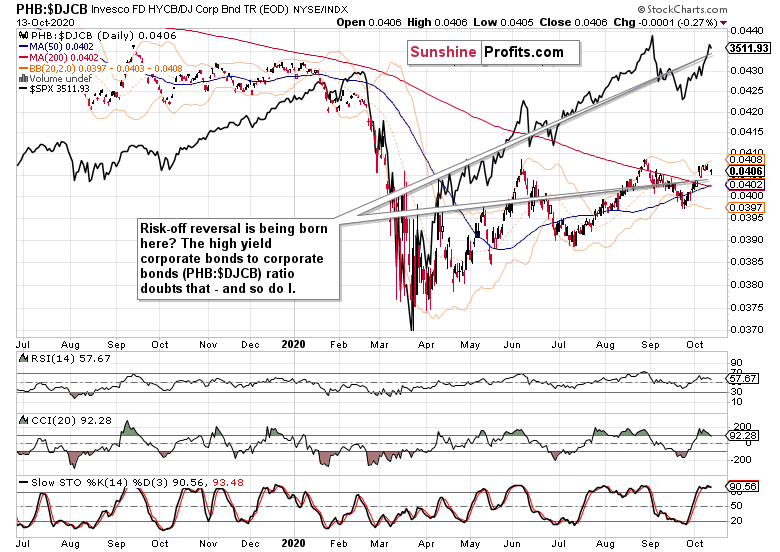
High yield corporate bonds to all corporate bonds (PHB:$DJCB) ratio isn't collapsing either – who in their right mind would call for it to reverse sharply to the downside this minute? The swing structure is still positive, and look for how high the ratio would go to trade once the elections dust settles down.
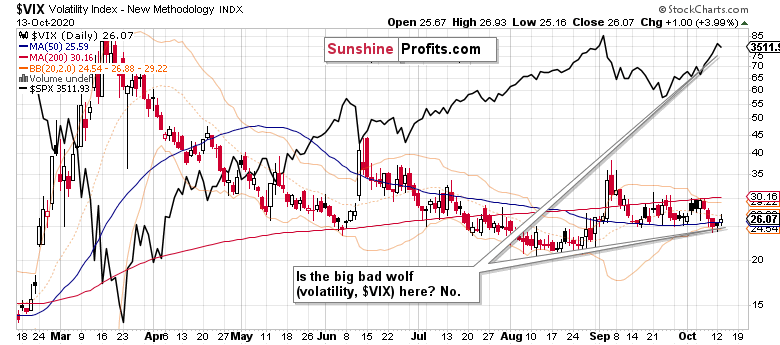
Volatility, USD and One More Currency Pair

Who is afraid of the big bad volatility wolf? VIX hasn't really risen much yet – on the other hand, the bears are not yet out of their caves celebrating either. Still, this view doesn't favor the sellers really much.

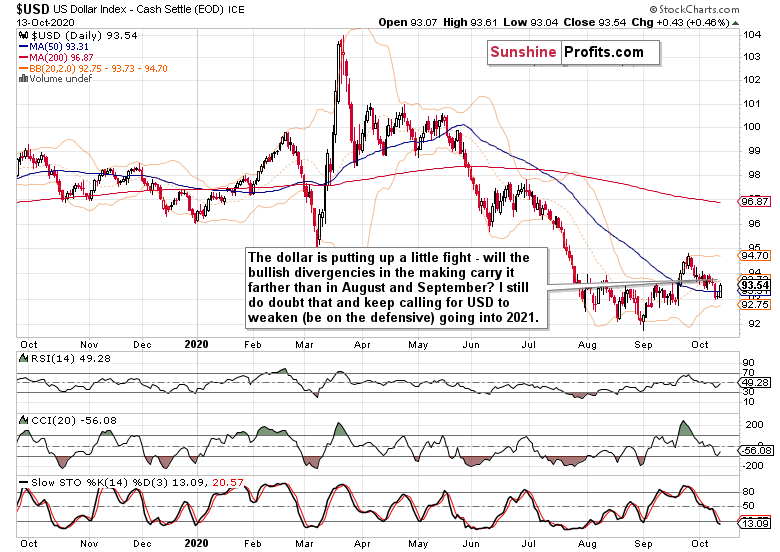
The dollar has jumped yesterday, but can it sustain the momentum for days on end? I doubt that, yet I am not underestimating the bullish divergencies in the making. They are still more likely though to get resolved with the greenback wasting its time and not rallying too hard – similarly to the way it traded in August and September. So, no bullish outlook for the greenback in the months to come – not from me.

On Thursday, I discussed currencies at length – why I am not looking for the reversal of fortunes in the risk-on trade, time lag or not in my many tools including those outside of the forex arena.
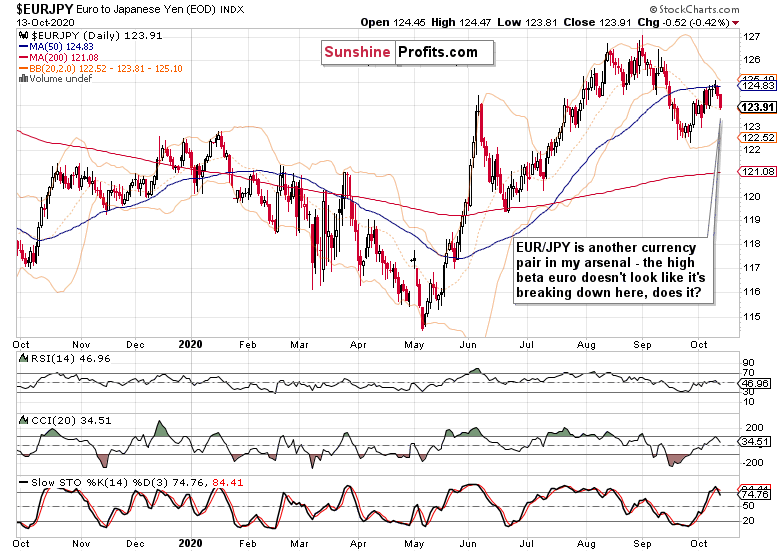
Today's currency chart features another good proxy for risk-on sentiment, the EUR/JPY currency pair. Does it look to you to have reversed to the downside for good, or to muddle through with a general upward bias? It's the latter option to me that is the frontrunner here.
Summary
Summing up, stocks are taking a breather, and signs are that it would be a wear you out, not a scare you out one. Credit markets aren't leading profoundly to the downside, the shift in S&P 500 sentiment isn't there yet to drive stock prices lower and fast. The current pause has the characteristics of a healthy one.
Could it be that we're looking at a bullish flag in stocks in the making? That's very likely in my view – and both the Russell 2000 and emerging markets concur.
Thank you for reading today’s free analysis. If you would like to receive daily premium follow-ups, I encourage you to sign up for my Stock Trading Alerts to also benefit from the trading action described - the moment it happens. The full analysis includes more details about current positions and levels to watch before deciding to open any new ones or where to close existing ones.
Thank you.
Monica Kingsley
Stock Trading Strategist
Sunshine Profits: Analysis. Care. Profits. -
The Staircase S&P 500 Rally – Where Is the Breather?
October 13, 2020, 9:10 AMStimulus optimism is reaching a fever pitch, and I decided to take long profits off the table late yesterday. That's 155-points in the black and all it took, were 8 trading sessions. Just as I confided in my yesterday's take on the trader-analyst's role, it oftentimes requires making sense of conflicting information such as distrust towards last week's reversal on Tuesday.
Stocks are after one heck of a short-term run, which was accompanied by a sizable bullish gap. The optimism over Mnuchin's counteroffer to Pelosi reigned supreme, and the S&P 500 made it known it got what it wanted. The question is whether the index can maintain the short-term momentum, or not. In other words, when and how would it digest its gains?
Let's check the charts for answers – for odds thereof, to be precise.
S&P 500 in the Short-Run
I’ll start with the daily chart perspective (charts courtesy of http://stockcharts.com ):

With yesterday's session, the price upswing has clearly accelerated, leaving both CCI and Stochastics very stretched. While that isn't reason enough for me to call for a reversal, some deceleration (fancy word for a breather, isn't it?) wouldn't surprise me – sideways trading next would be actually healthy.
As I wrote within yesterday's medium-term analysis section, this week will likely be leaner in terms of S&P 500 price moves – and that could coincide with a very short-term patch of stocks treading water, relatively speaking. Simply put, I am sticking to my yesterday's call of not looking for much downside really.
Credit Markets’ Point of View

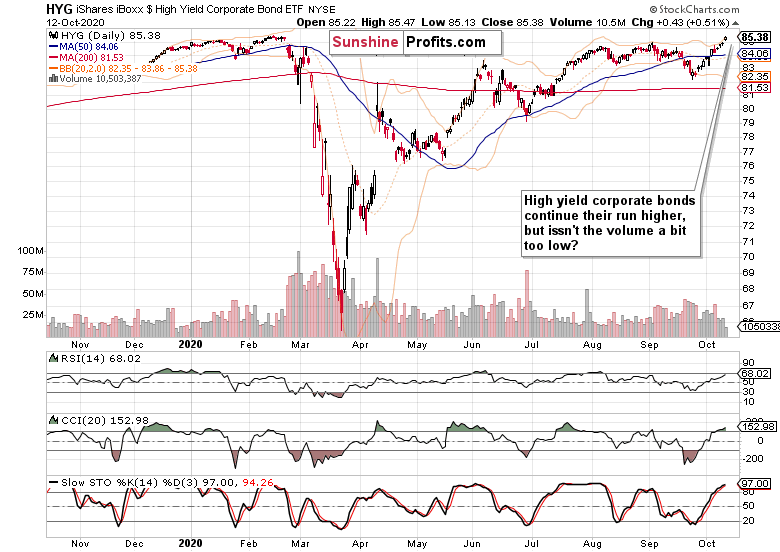
High yield corporate bonds have likewise risen yesterday, the bullish gap was there too – but volume conspicuously wasn't. That's a short-term red flag to me, a reason why some consolidation next is my go-to scenario for stocks.

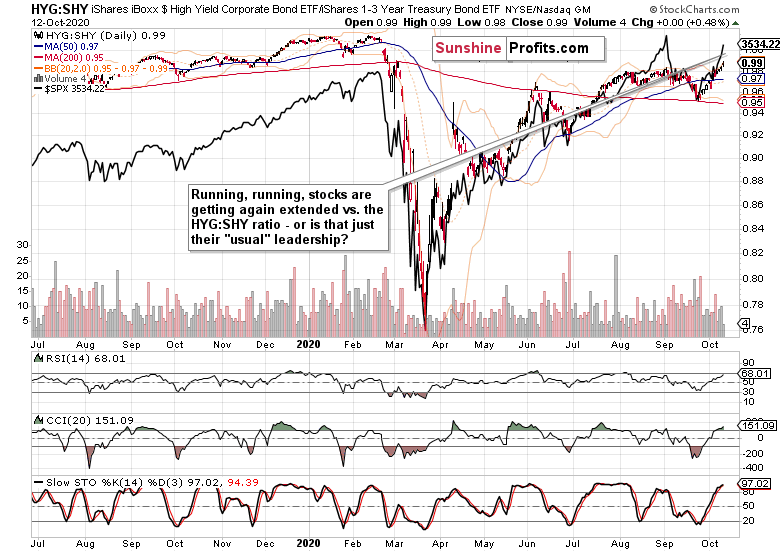
S&P 500 is again assuming leadership, and its extension vs. the high yield corporate bonds to short-term Treasuries (HYG:SHY) ratio is apparent. The $64,000 question is whether the stock upswing is just starting and the junk corporate bonds ratio would go on to catch up to a degree, or whether a local top is about to be made.
Out of these two options, I lean towards the former. While the odds of a short-term consolidation (this week) have gone up, I don't think we would see a very sharp, or high stretching local top. Some sideways trading followed by a measured push higher, looks most likely – but watch out for election headline surprises!
Treasuries, USD and Technology

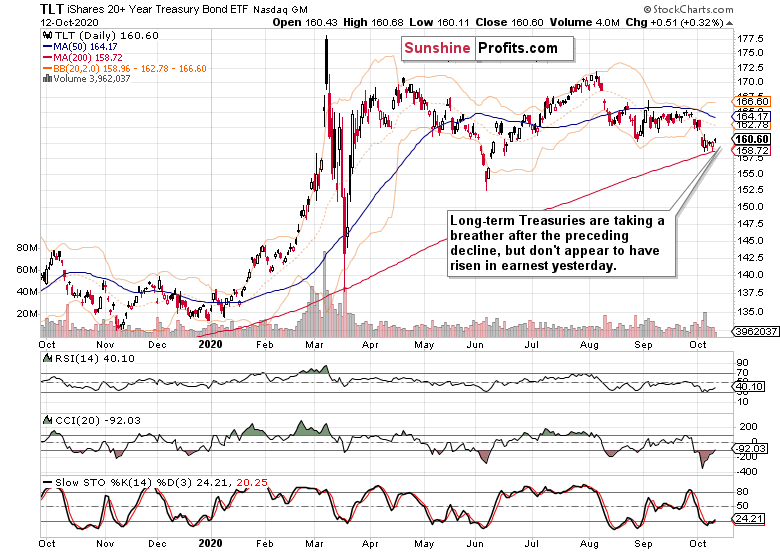
Long-term Treasuries (TLT ETF) have come under pressure recently, and their rebound is still looking corrective in nature. Especially since yesterday's upswing lacked volume.

Let's recall my Oct 09 dollar analysis:
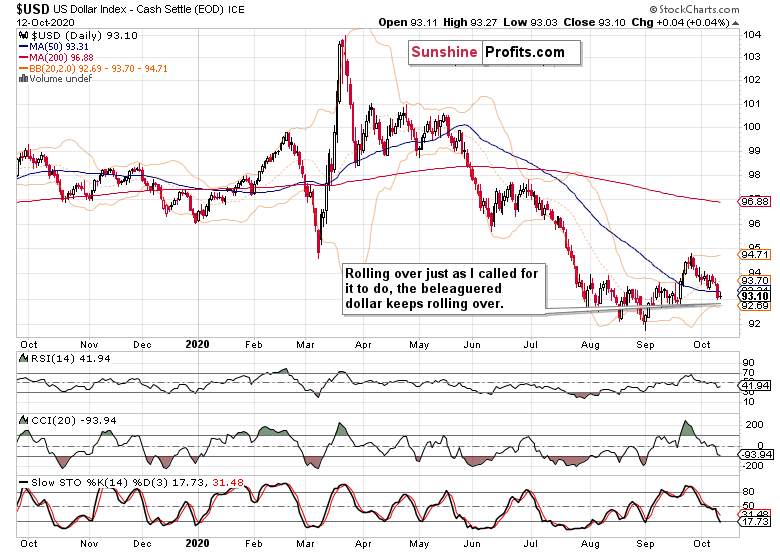
(…) The bulls overcame that (50-day moving average) barrier, yet promptly ran out of steam, and the sideways-to-down trading is working hard to reassert itself once again now. The dollar clearly isn't standing in the way of further stock or commodities rally. The reflationary efforts are working, and the markets are once again salivating at the fiscal stimulus prospects – the saga of generally higher S&P 500 goes on, and the world reserve currency is likely to remain on the defensive.
So far so good. Unless uncertainties flare up – think botched stimulus deal pre-elections, or post-election drama (recounts, mail-in ballots, no concession of defeat) that might not be in too short a supply – the dollar won't really have a chance to spike higher in my opinion.

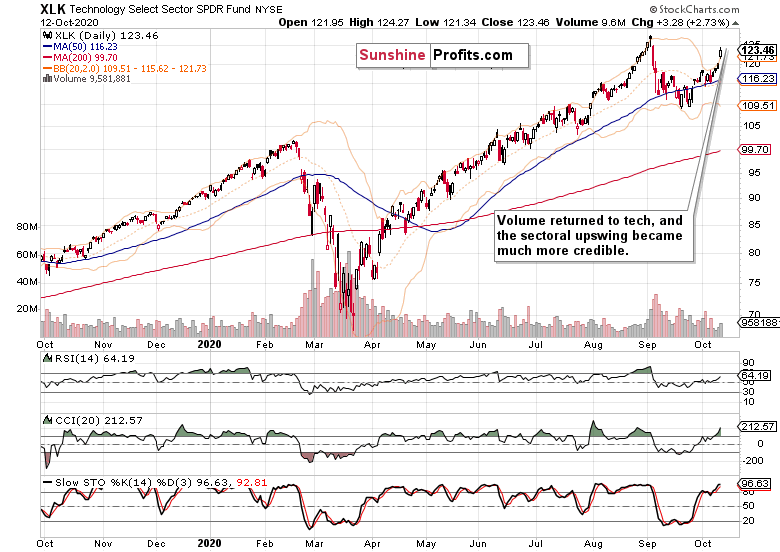
Technology (XLK ETF) is turning more positive here – volume is returning, which bodes well for the medium-term – and for the short-term too. The sector is waking up, and ready to lead S&P 500 to further gains – and crucially in my view, with the financials (XLF ETF) supporting that move finally (just as I wrote on Wednesday and Friday).
Summary
Summing up, I look for stocks to continue in their breakout mode, but after the prior week and yesterday, a brief pause would be healthy. Would be, and it depends what kind of one we would get (if any). The credit markets are though favoring one to arrive relatively shortly – but don't hold your breath, it won't be a deep(ly lasting) one likely.
Stimulus negotiations are still a wildcard, and I see much of the positive effect (the hopes) already priced into the market. With both sides unlikely to be perceived / blamed for failure of talks, the odds are favoring more some sort of compromise than a break-up. Will the market sell off a little on that news?
Thank you for reading today’s free analysis. If you would like to receive daily premium follow-ups, I encourage you to sign up for my Stock Trading Alerts to also benefit from the trading action described - the moment it happens. The full analysis includes more details about current positions and levels to watch before deciding to open any new ones or where to close existing ones.
Thank you.
Monica Kingsley
Stock Trading Strategist
Sunshine Profits: Analysis. Care. Profits.
Free Gold &
Stock Market Newsletter
with details not available
to 99% investors
+ 7 days of Gold Alerts
Gold Alerts
More-
Status
New 2024 Lows in Miners, New Highs in The USD Index
January 17, 2024, 12:19 PM -
Status
Soaring USD is SO Unsurprising – And SO Full of Implications
January 16, 2024, 8:40 AM -
Status
Rare Opportunity in Rare Earth Minerals?
January 15, 2024, 2:06 PM

