-
S&P 500 Bull Run and the Stimulus Game of Chicken
October 12, 2020, 9:16 AMWildly bullish ride on Friday, and my already very profitable long position has become dramatically more so. Who would have thought that given the events of prior week? Those reading my analyses, have been on the right side of the market, making money.
That's surely a better proposition than to be calling for a deep correction or even crash – and there is really no shortage of bears. They're still way more numerous than the bulls if you look at the sentiment readings. On the surface, it makes it appealing to join the majority, but that's not what great minds and independent thinkers usually do.
The way I view financial analyst's role, is to make sense of many times more or less conflicting data, and present the trading calls, the outlook that brings profits to the people. Uncertain and volatile times have nothing to do with that – let it be so always. That's the cutting edge, the dividing line in my view, for being nimble and not stubborn in one's ways is what truly generates value for the readers and subscribers.
In stocks, that means being still long – and those familiar with my trading ways, know that I can and do turn on a dime, both in trading and in life. No permabull, no permabear – my pledge is to daily serve your interests.
Great parallel, but how is that really applicable to the S&P 500 right now?
S&P 500 in the Medium- and Short-Run
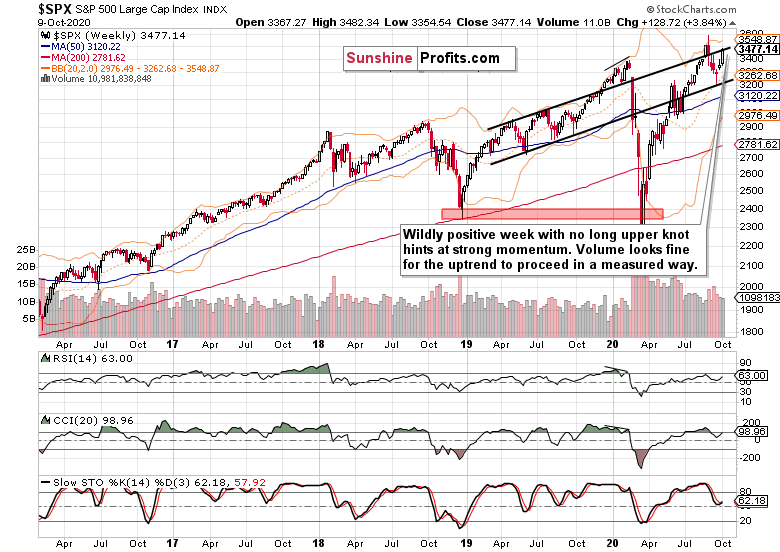
I’ll start with the weekly chart perspective (charts courtesy of http://stockcharts.com ):
I wrote these words 7 days ago:
(…) The weekly price action points higher, true, but the sizable upper knot is sticking out like a sore thumb. While not all the downside appears to be in looking at this chart alone, I am not calling for a new downswing to start here. The weekly indicators remain fairly neutral, and sideways trading with bullish bias reasserting itself, is the best the bulls can look for.
The new downswing indeed didn't start, and stocks reacted with euphoria to the Trump recovery and on-off-on stimulus talks. The result was even better that I conservatively assessed as likely.
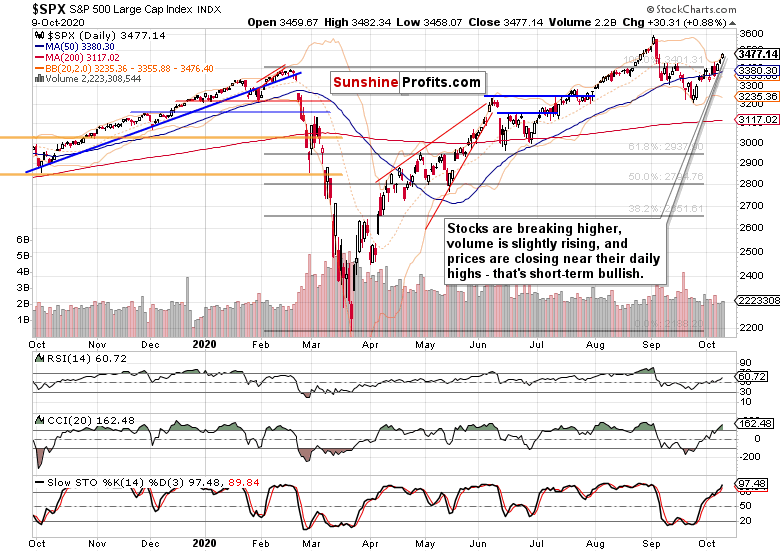
Tuesday's breakout invalidation attempt looks now to be a distant memory, and stock bulls are in the driver's seat. The daily volume is very slowly rising, and doesn't point at the buyers' exhaustion or at the bears ready to step in.
Yes, it's the upswing that is to be trusted here – and it’s in line with my call for October to end in the black. Even the September call of mine for the month to finish with a sizable lower knot ended up true. For the days to come though, I am not looking for much downside really – and that's an understatement.
Credit Markets’ Point of View
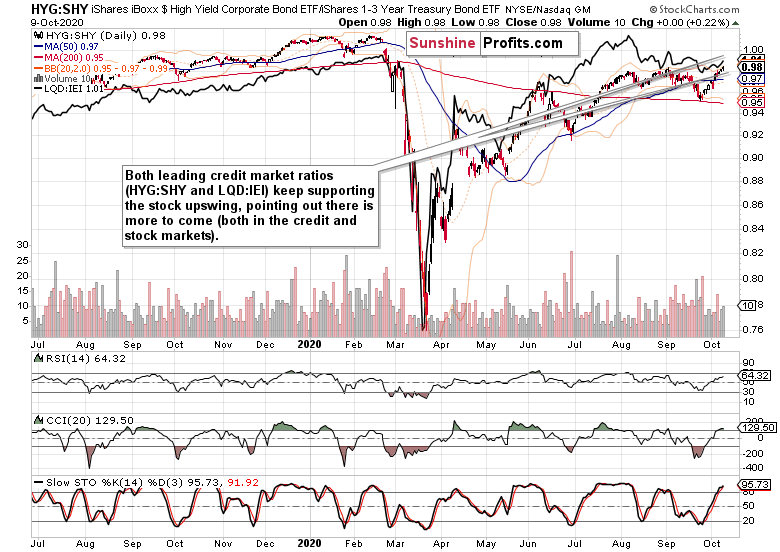
Both leading credit market ratios – high yield corporate bonds to short-term Treasuries (HYG:SHY) and investment grade corporate bonds to longer-dated Treasuries (LQD:IEI) – are done pausing – they are moving higher for the second day in a row. That's healthy for the stock upswing to go on, to see both ratios moving in unison.
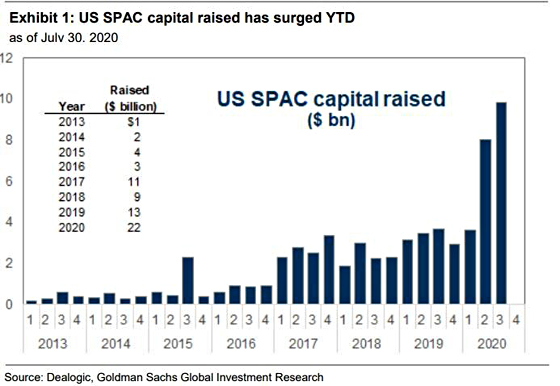
A few notes on the red hot speculation in blank check IPOs market (SPACs) that I saw David Stockman talk about and compare to corporate junk bonds:
Long live the financial engineering – or is such a hallmark a sign of a top approaching, similarly to white elephant projects such as great skyscrapers (Burj Khalifa – Dubai 2010)?
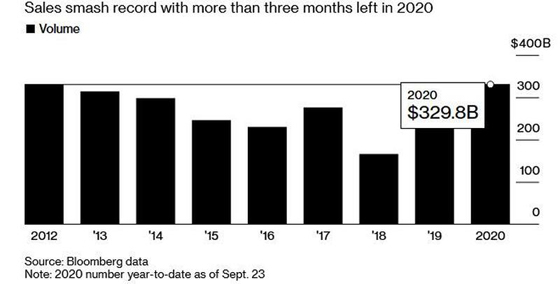
Meanwhile, high yield corporate bonds issuance has been smashing records in 2020…
This bull evidently still wants to run some more.
S&P 500 Market Internals and Technology
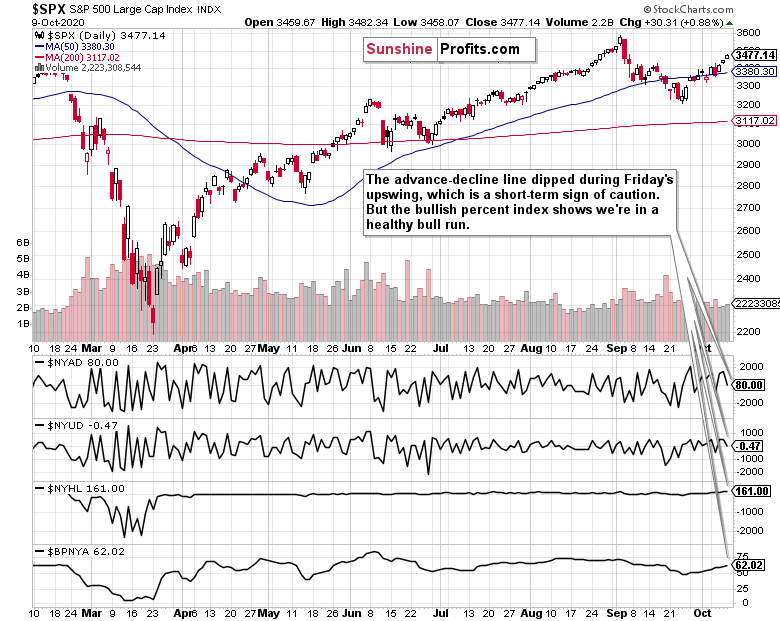
The fly in the very short-term ointment is the advance-decline line performance. We just saw a price upswing, yet the metric moved lower. Does it increase the odds of a downswing next? Perhaps, but that would turn out as a consolidation in an upswing only in my opinion. In other words, it would be over relatively shortly.
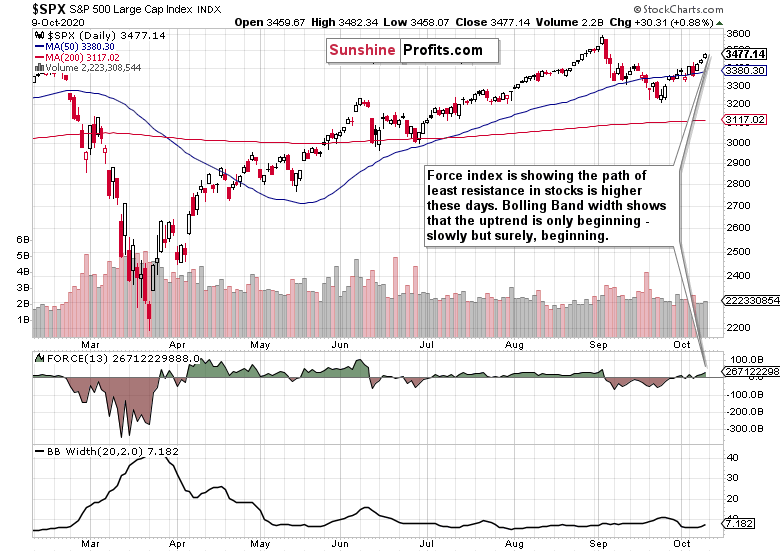
Force index is moving into a more positive territory – that's just what you would expect from indicators such as MACD and the like. The budding uptrend is strengthening, and that's the message of both the Force index, and the Bollinger Band width.
My other trusted indicator, ADX (it measures the strength of the trend), is more cautious here – and that fits in well the advance-decline line's message discussed just above. That's just the two of them – apart from the regularly chart-featured ones, I like PMO, MACD, Williams' Ultimate Oscillator – and I work with them in non-traditional ways too…
In short, we had a great week in stocks, but this one might not be as rich in terms of price moves.
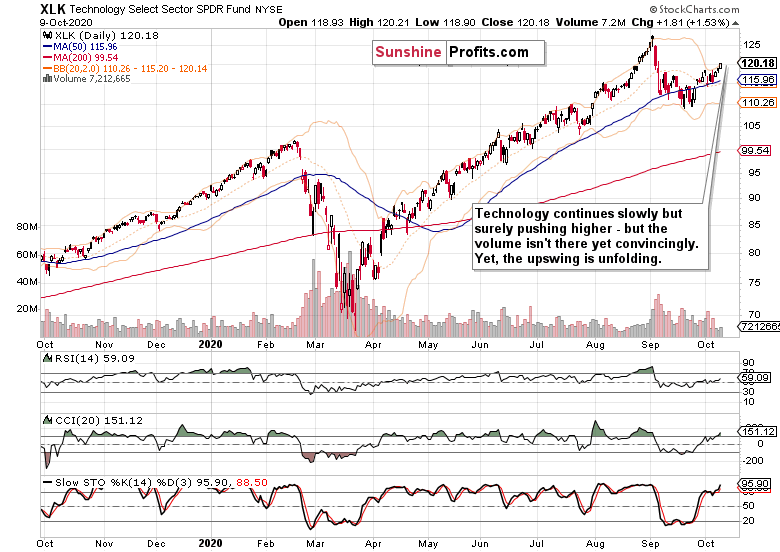
Technology (XLK ETF) is positive here – yet the volume supports short-term caution. Still, the uptrend is going on, and the question remains how fast and how far before the next breather arrives, will this leading sector take the 500-strong index.
Summary
Summing up, I look for stocks to continue in their breakout mode, but after the strong trading just in, the week in progress might turn out to be a more measured one. The array of signs though keeps supporting the bulls rather overwhelmingly. Stimulus negotiations are a wildcard, and I see much of the positive effect (the hopes) already priced into the market – be it before elections, or a bit later, the markets can bridge that. Still, it can bring a short-term negative spanner into the bulls' works should there be another show of brinkmanship. With both sides unlikely to be perceived / blamed for failure of talks, the odds are favoring more some sort of compromise than a break-up.
Thank you for reading today’s free analysis. If you would like to receive daily premium follow-ups, I encourage you to sign up for my Stock Trading Alerts to also benefit from the trading action described - the moment it happens. The full analysis includes more details about current positions and levels to watch before deciding to open any new ones or where to close existing ones.
Thank you.
Monica Kingsley
Stock Trading Strategist
Sunshine Profits: Analysis. Care. Profits. -
S&P 500 Bull Market – Commodities Confirm
October 9, 2020, 9:46 AMAnother day, another gain in stocks – in spite of the almost textbook Tuesday's reversal that I didn't trust one bit. The slow grind higher in stocks goes on, and my previously profitable long position has become even more so today.
Such was the entry to my yesterday's analysis, and it can stay the same also today. While yesterday I talked the mid-September highs, let's start shifting attention to the early September climactic highs slowly but surely again. Yes, S&P 500 is breaking higher.
On Wednesday, I gave you several reasons why the bull run will succeed, and they came from the bond markets. On Thursday, I brought you the currency markets' confirmation. And today, I'll present the case from the commodities arena.
Let's see first yesterday's happenings in stocks.
S&P 500 in the Short-Run
I’ll start with the daily chart perspective (charts courtesy of http://stockcharts.com ):
My yesterday's words remain valid also today:
(…) I told you it wasn't a breakout rejection in earnest, and prices closed back above the Feb highs yesterday. And again, the session's lower volume doesn't concern me – as the worst case scenario, I see a protracted sideways consolidation before the Feb highs are decidedly overcome.
But that's not the most likely possibility – I think that these highs would be beaten in a few days. After the stormy September, the month of October is shaping up to be calmer thus far – but I look for the approaching elections to bring turbulence still, as in later this month.
Credit Markets’ Point of View
Both leading credit market ratios – high yield corporate bonds to short-term Treasuries (HYG:SHY) and investment grade corporate bonds to longer-dated Treasuries (LQD:IEI) – are done pausing – they have moved higher yesterday. Mirroring each other's moves, they're on an upswing – and that bodes well for the stock upswing's healthy footing.
Technology and Financials
Technology (XLK ETF) is continuing its rebound, yet on decreasing volume. Unless the bears step in, that's not too concerning. Instead, a muddle through with an upward bias remains the more likely scenario.
Financials (XLF ETF) are starting to see better days, now that the 200-day moving average is finally conquered. I do think that this breakout will stick.
Commodities and Economic Recovery
The red metal didn't disappoint me – just recall my Friday's observations:
(…) The red metal truly plunged yesterday, and on heavy volume. Sure, it was vulnerable to a takedown following the rebound off its 50-day moving average, but the slide looks a bit overdone. Certainly, it doesn't invalidate the bullish chart posture as copper stands to capitalize on the electric cars fever and the like it or not rush into green economy in general. The setback suffered will thus be reversed relatively shortly in my opinion.
The price is primed to go higher, and all we've seen in my opinion, is a breakdown attempt that will be proven to have failed.
What loooked like a breakdown 7 days ago to some, I called to be invalidated – and here we are, solidly trending higher again. The verdict is clear – the recovery goes on, and higher copper prices are in our future.
Oil remains under pressure but is holding up nicely – and actually the volume examination hints at slightly better days ahead. Given the demand destruction and new lockdowns popping up here and here overseas, that's still a relatively good interim outcome for black gold, regardless of its underperformance of other commodities.
Materials (XLB ETF) and all the metals in general, that's another cup of tea – and they aren't reacting to dollar weakness only. Part of the broad advance in this ETF is the result of the ongoing economic recovery, which is naturally quite uneven given the real world circumstances.
Baltic Dry Index ($BDI), this general bellwether of the shipping industry, paints an encouraging picture of a pickup in economic activity, and that's good both for the real economy and for the stock market.
Checking upon the dollar, the world reserve currency remains under pressure. Not only that I called late in spring for it to roll over, but on September 11, I noted that:
(…) Barely recovering from yesterday's downswing attempt, they're wasting precious time to reach up beyond the 50-day moving average. The advantage of bullish divergences in the daily indicators, is slowly but surely being lost.
The bulls overcame that barrier, yet promptly ran out of steam, and the sideways-to-down trading is working hard to reassert itself once again now. The dollar clearly isn't standing in the way of further stock or commodities rally. The reflationary efforts are working, and the markets are once again salivating at the fiscal stimulus prospects – the saga of generally higher S&P 500 goes on, and the world reserve currency is likely to remain on the defensive.
Summary
Summing up, I look for stocks to continue in their breakout mode, and taking on the early September highs is merely a question of time in my view. On Wednesday, I laid down a strong case why the debt markets support further S&P 500 gains, yesterday I discussed several currency pairs, which also favor such conclusion overwhelmingly. And today's analysis of commodities that are far from overheated, speaks in favor of the stock bull run having quite further to go. And yes, the broad repertoire, the myriad of my tools ranging from market breadth, sectoral analysis, other stock indices, narratives, headlines and macroeconomic data analysis, concurs.
Thank you for reading today’s free analysis. If you would like to receive daily premium follow-ups, I encourage you to sign up for my Stock Trading Alerts to also benefit from the trading action described - the moment it happens. The full analysis includes more details about current positions and levels to watch before deciding to open any new ones or where to close existing ones.
Thank you.
Monica Kingsley
Stock Trading Strategist
Sunshine Profits: Analysis. Care. Profits. -
S&P 500 Bull Market – Currencies Weigh In
October 8, 2020, 9:33 AMAnother day, another gain in stocks – in spite of the almost textbook Tuesday's reversal that I didn't trust one bit. The slow grind higher in stocks goes on, and my previously profitable long position has become even more so today.
With mid-September highs in sight, the question becomes when will the S&P 500 power through, and take on the early September climactic highs that I called out precisely to the day?
Yesterday, I gave you several reasons why the bull run will succeed, and they came from the bond markets. Both fundamental and technical in nature, showing a great future for the S&P 500 in the many weeks ahead.
At the same time though, I did cautiously say within the summary that as for now, a very measured grind higher in the 500-strong index remains a safe bet for the days and immediate weeks ahead.
Let's check the market pulse for the health of yesterday's advance and its extension in today's premarket.
S&P 500 in the Short-Run
I’ll start with the daily chart perspective (charts courtesy of http://stockcharts.com ):
I told you it wasn't a breakout rejection in earnest, and prices closed back above the Feb highs yesterday. And again, the session's lower volume doesn't concern me – as the worst case scenario, I see a protracted sideways consolidation before the Feb highs are decidedly overcome.
But that's not the most likely possibility – I think that these highs would be beaten in a few days. After the stormy September, the month of October is shaping up to be calmer thus far – but I look for the approaching elections to bring turbulence still, as in later this month.
Credit Markets’ Point of View
High yield corporate bonds (HYG ETF) didn't move much yesterday. The higher open was defended successfully, but the lower volume hints at a likely consolidation shortly. I expect it would take a brief while before the September HYG highs are overcome – yesterday's volume is not a show stopper.
Both leading credit market ratios – high yield corporate bonds to short-term Treasuries (HYG:SHY) and investment grade corporate bonds to longer-dated Treasuries (LQD:IEI) – have paused yesterday. The more risk-on one (HYG:SHY) is still leading higher relatively speaking, but until I see its move supported by LQD:IEI more so than is the case currently, I am not calling for dramatic credit market ratios' moves higher.
SPX Volatility and Force Index
Volatility got a little elevated at the beginning of October, but appears to have made a local peak, which would facilitate the stock upswing to reassert itself somewhat more next.
Time flies – it's been mainly in March and April when I was featuring the S&P 500 Force index often. The September dive is clearly visible in this powerful indicator (it combines prices and volume), and the subsequent recovery brought it slightly above zero. That's where it's meandering right now, and the current trajectory sets stocks up as likely to extend gains modestly in October.
Currencies and Risk-on Sentiment
However hopelessly indebted the Japanese economy, the yen is a safe-haven currency and a key funding one for carry trades - these are "brainless safe bets" where the investor borrows at low or negative rates (hello Japan), and parks the funds in e.g. U.S. Treasuries or whatever higher-yielding debt instrument of their choosing (since the Fed quelled the corona panic in spring, the juicy yield differential between these government bonds isn't really there anymore).
Such trades work until they don't – and once they don't, we see their rapid liquidation and money flowing back to the funding currency, the Japanese yen. So, has the yen been really spiking recently?
Bottoming days before the stock market did, USD/JPY is on the mend, which means that the risk-on spirit is returning, solidly returning.
Another currency barometer I like to use for stocks (for oil, I use USD/CAD due to the importance of Canadian tar sands), is EUR/CHF. Euro is a high beta currency, which means that it rises when the global economy starts doing better – just look at EUR/USD and how it left the sub-1.10 levels in the dust in early June. Swiss franc is one of the currencies that tend to benefit from flight to safety.
Over many recent weeks, EUR/CHF has been trading in a rather stable band, giving no sign of either a systemic stress (credit default swaps do a great job highlighting such tensions too), or a headlong rush into the riskiest of trades. In other words, the measured pace of S&P 500 appreciation can go on.
Summary
Summing up, I look for stocks to extend gains from yesterday's sharp upswing that might have caught off guard those not reading my analyses. A day ago, I have laid down a strong case why the debt markets support further S&P 500 gains, and today, I discussed several currency pairs, which also favor such conclusion overwhelmingly. This comes on top of the broad repertoire of my tools ranging from market breadth, sectoral analysis, other stock indices, narratives, headlines and macroeconomic data analysis.
In short, the economic recovery goes on, and so does the stock bull run – and that means more profits ahead.
Thank you for reading today’s free analysis. If you would like to receive daily premium follow-ups, I encourage you to sign up for my Stock Trading Alerts to also benefit from the trading action described - the moment it happens. The full analysis includes more details about current positions and levels to watch before deciding to open any new ones or where to close existing ones.
Thank you.
Monica Kingsley
Stock Trading Strategist
Sunshine Profits: Analysis. Care. Profits. -
S&P 500 Bull Market - It's Reflation Vs. Deflation
October 7, 2020, 10:52 AMUpbeat news, upbeat, anywhere you look - such was the mood yesterday until Trump announced end to stimulus talks, and stocks fell like a rock within minutes. Going from my open long trade's profitable 3420 to its overnight bottom at 3330 before recovering black into the black at well over 3370 at this very moment.
Headline risk happens, and works both ways. A few days ago, I got a question as to my Q4 trading strategy, to which I replied that for internal publishing reasons, I would be quite likely using more limit orders as of now than subscribers were used to from me, which means less short-term trades.
But coming back to headlines working both ways, and how that relates to my currently open trade. Would it have made sense to lock in open profits during the second half of yesterday's regular session? No, because the break above Feb highs (as seen on the daily chart later on) was well underway with the market internals supporting it to go on.
And that's the key also today - the market internals examination. Do they still support the stock bull run - was yesterday's slide as much a flash in the pan as Trump's corona test? The question will be elegantly answered right after I present your with the daily chart.
Let's dive in and check whether the setback fits my yesterday's words on bull markets climbing a wall of worry:
(...) There will be many more instances such as this hiccup - and stocks will be more than willing to look past. Mark my words, this bull market isn't going to end in 2020 - but perhaps it'll become finally broadly recognized as such still this year to the dismay of still much more numerous bears compared to the bulls. Sorry, no gloom and doom, no calls for a market crash, though I expect turbulences to go on till elections are over and done with.
S&P 500 in the Short-Run
I'll start with the daily chart perspective (charts courtesy of http://stockcharts.com ):

Right as stock prices were returning above the Feb highs, the Trump stimulus news hit the wires. Sure it has made the candle look ominous at first sight, but is this reversal to be trusted? Raise your hands if you believe that there won't be a stimulus deal in the end. I view such hardball tactics as part of horse trading. Who blinks first, if you will.
That's why I am not reading too much into yesterday's plunge, and because of these dips likely having a very limited shelf life and the above described publishing limitations, I'm not letting them shake me out of profitable trades that make sense from both short- and medium-term perspective.
Credit Markets and the Fed

High yield corporate bonds (HYG ETF) didn't give up as much ground as stocks yesterday. While the volume was heavy, the price print says that this is no reversal. In other words, risk-on has further to run - and stocks with it.
And that brings me to the Fed and its actions to counter the deflationary corona shock. Aggressive rate cutting, balance sheet expansions and backstops. Similarly to the Great Financial Crisis of 2007-2009, the forces of deflation and inflation are battling it out - but this time, the newly created money doesn't stay on the commercial banks' balance sheets, it flows more into the real economy instead..
Is the pace of new money creation (the word reflation better describes the Fed's efforts) faster than the rate of its destruction? Let's dive into Danielle DiMartino Booth tweet that I ran into at Tom Luongo's Gold Goats 'n Guns:

It's common knowledge that the Fed's mission is to fight deflation tooth and nail. And as I have been saying over the summer, the central bank's interventions have worked, reinflation goes on, and stocks benefit - see the Jun 05 article called Reaping the Early Benefits of Inflation in Stocks.

Long-term Treasuries (TLT ETF) is another chart you see me feature quite often. I don't see a flight to safety here, and yesterday's upswing is actually a disappointing one (not for its upper knot merely). Yields are rising, which is conducive to the economic recovery - there is no flight to safety here.

In the 1980s, government bonds used to be called certificated of guaranteed confiscation - thanks to the galloping inflation outpacing bond rates. With Treasury inflation-protected securities (TIPS), the investor at least stands some chance against this invisible tax.
The TIPS chart (TIP ETF) shows that the credit markets aren't really questioning the Fed - there is no breakdown but I see the Fed's resolve to step in as likely to get tested shortly. Remember, the Fed is active here, and aims to send a message that inflation expectations are rising - on Aug 07, I pointed out that gold is frontrunning that in my article S&P 500 Bulls Meet Non-Farm Payrolls.
But the point is now that the Fed's inflation-is-here message hasn't progressed much in the last two months, which is why I see the central bank as likely to act and counter the above chart's sideways patch.

Just look at this 10-year Treasury yield's chart ($TNX). It's kind of a mirror view of the above - when bond yields rise, regular Treasury prices fall. And as the 10-year Treasury yield is approaching yesterday's open (the high of the red candle), it's a pressure on real yields to rise - which is not the development the Fed would prefer to see (debt servicing costs are another argument here).
In short, inflationary expectations aren't where the Fed wants them to see (remember the new 2% target redefined as an average inflationary reading instead of a one-off one), and we can look for the central bank to do more of the same if it hadn't worked out so far totally marvelously as the TIPS soft patch shows.
The other key takeaway is that the Fed hasn't lost control over the markets, far from it. Its actions aren't seriously questioned.
And the S&P 500? As I wrote already before, stocks love few things more than money printing - asset price inflation - before inflation starts to bite. Yes, the bull market is alive and well - and financials (XLF ETF) will prove that by performing better over the coming weeks and months.
Summary
Summing up, I look for stocks to recover from yesterday's setback in a heartbeat. The credit markets are painting a convincing picture, with the risk-on sentiment having an upper hand. The Russell 2000 and emerging market stocks remain strong, and so does copper. The dollar again didn't get pretty much anywhere. Once technology returns to trading with strength, the S&P 500 would be seriously boosted. As for now, a very measured grind higher in the 500-strong index remains a safe bet for the days and immediate weeks ahead.
Thank you for reading today's free analysis. If you would like to receive daily premium follow-ups, I encourage you to sign up for my Stock Trading Alerts to also benefit from the trading action described - the moment it happens. The full analysis includes more details about current positions and levels to watch before deciding to open any new ones or where to close existing ones.
Thank you.
Monica Kingsley
Stock Trading Strategist
Sunshine Profits: Analysis. Care. Profits.
Free Gold &
Stock Market Newsletter
with details not available
to 99% investors
+ 7 days of Gold Alerts
Gold Alerts
More-
Status
New 2024 Lows in Miners, New Highs in The USD Index
January 17, 2024, 12:19 PM -
Status
Soaring USD is SO Unsurprising – And SO Full of Implications
January 16, 2024, 8:40 AM -
Status
Rare Opportunity in Rare Earth Minerals?
January 15, 2024, 2:06 PM

