

-
Banks Kick Off Earnings Season, Are You Fading the CPI Fear?
July 12, 2021, 11:44 AMIt is the start of earnings season for US equities, with major banks reporting this week. Let’s see how bank earnings pair up with the much anticipated CPI data on Tuesday morning.
After last week’s sudden Thursday dip and subsequent rebound on Friday to close at all-time highs in the $SPX, I hope the weekend has you feeling relaxed and rejuvenated. I say that because this week could provide some elements of fireworks; given the economic data on tap and the beginning of the Q2 earnings season.
The Banks.
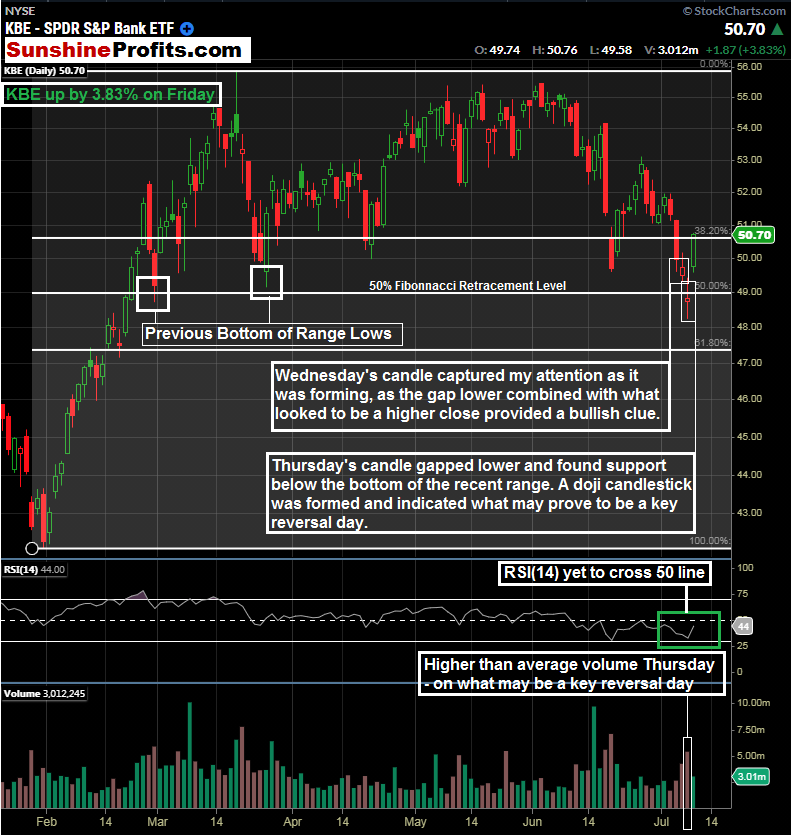
In the second half of last week, our analyses focused on interest rates and the banks. In case you missed it, we were specifically looking at interest rates via TLT and banks via KBE. Friday was a great day for the banks...could this be a harbinger of things to come for bank earnings?

Figure 1 - KBE S&P 500 Bank ETF January 18, 2021 - July 9, 2021, Daily Candles Source stockcharts.com
Please refer to the July 6th publication where we analyzed KBE in depth. I think there are so many reasons to like the banks here. If you are a premium subscriber, you received an alert email on Wednesday regarding some intraday trading activity and levels.
Note that the RSI(14) has not even crossed the 50 line yet. These levels could indicate that there is still time to get on board the banks ahead of earnings. Some folks are fundamentally predicting a big bank's earnings season this week.
For example, we have Sam Stovall, chief investment strategist at CFRA Research looking for the second-best YOY quarterly gain in the last 25 years for the banks.
KBE tacked on 3.83% on Friday. If you recall, part of the reason we initially started to love the banks (KBE) was that it had pulled back over 9% from its 2021 highs; as the S&P 500 had continued to make new highs.
Putting that together with the technical action late last week and heading into earnings, it could be a great place to continue to be. We will be looking for exit levels in the coming days and weeks, with Premium Subscribers receiving the intraday alerts.
Interest Rate Action and Reaction
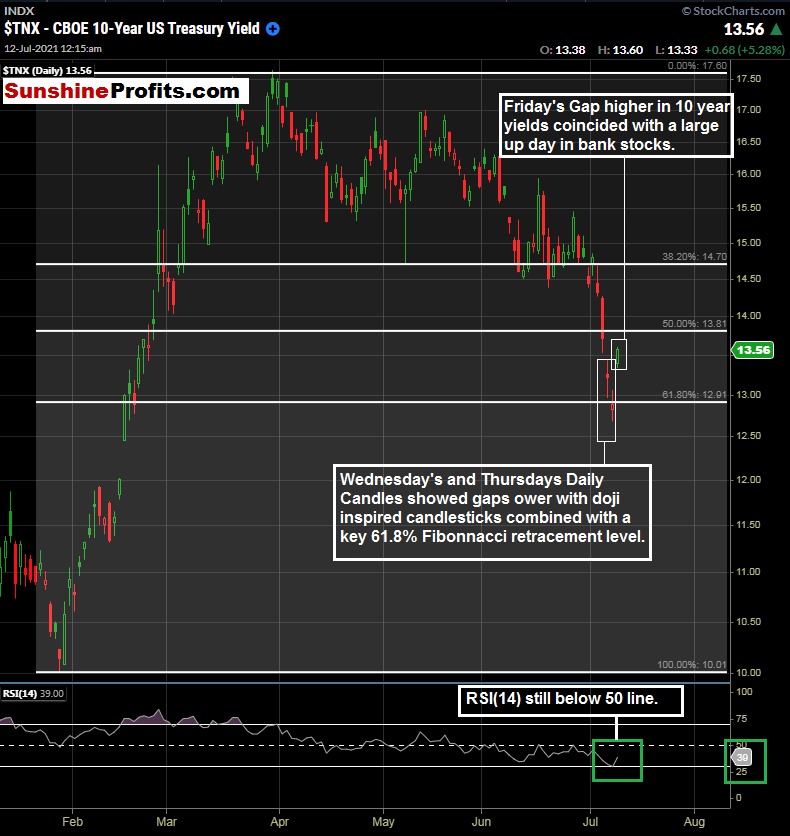
As banks surged on Friday ahead of earnings, interest rates rose along with them. That is part of a goldilocks scenario for banks. Has the time for banks come and the turn in interest rates along with it?

Figure 2 - Ten-Year Treasury Note Yield January 7, 2020 - July 9, 2021, Daily Candles Source stockcharts.com
Ten-year note yields rose on Friday in tandem with bank stocks. Please see the July 7th and July 8th publications for more detail on $TNX.
So far this morning, it has been a quiet session in equities and bonds. Since we have CPI data on tap for tomorrow at 8:30 AM, it is to be expected.
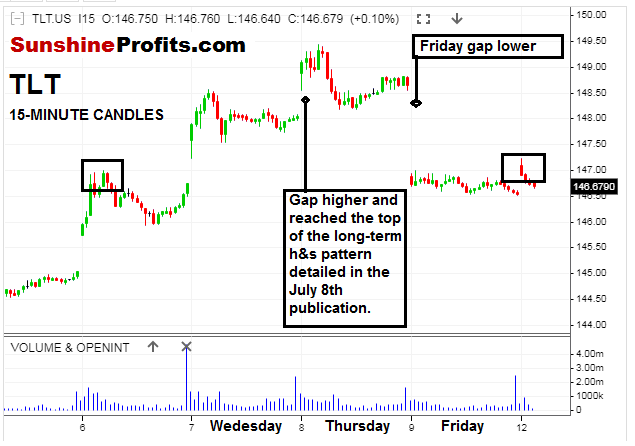
Our interest rate analysis led us to TLT and a potential long-term head in shoulders pattern being created. As bond yields rose on Friday, TLT fell nicely.

Figure 3 - TLT iShares 20+ Year Bond ETF July 2, 2021 - July 12, 2021, 10:35 AM, 15-Minute Candles Source stooq.com
The 15-minute candles in TLT show an exhaustion gap up to levels we were watching on Thursday; and a gap lower on Friday. Notice what may be a short-term head and shoulders pattern forming here on the intraday charts that coincides with the long-term head and shoulders pattern that we identified. I like to call this the matching pattern within the pattern. More on that another time.
This morning, we do see the equities beginning to gain a bit of steam and the bond yields dropping slightly. We have CPI data tomorrow morning, so it could be a quiet session as traders look to tomorrow's CPI release.
Are you fading the CPI data fear? Is it possible that tomorrow’s inflation data release is not so bad, and that the inflation is indeed transitory, as the Fed has spoken about on multiple occasions? I think there is a possibility of this, and it has never been a good idea to fight the Fed.
I like the idea of being long the banks and short bonds (higher interest rates) heading into tomorrow’s CPI release and this week’s bank earnings releases.
Now, let’s cover the stop loss, take profit, and other key levels in KBE and TLT, along with analyses on the other seven markets we are covering for Premium Subscribers.
Not a Premium subscriber yet? Go Premium and receive my Stock Trading Alerts that include the full analysis and key price levels.
Thank you for reading today’s free analysis. If you would like to receive daily premium follow-ups, I encourage you to sign up for my Stock Trading Alerts to also benefit from the trading action described - the moment it happens. The full analysis includes more details about current positions and levels to watch before deciding to open any new ones or where to close existing ones.
Thank you.
Rafael Zorabedian
Stock Trading Strategist -
S&P 500 Lower in Early NY Trade, Bonds Bid Near Key Levels
July 8, 2021, 10:40 AMOverseas markets were lower overnight on the chatter of Covid variants and the ECB. The S&P 500 is lower by over 60 handles in early NY cash trading.
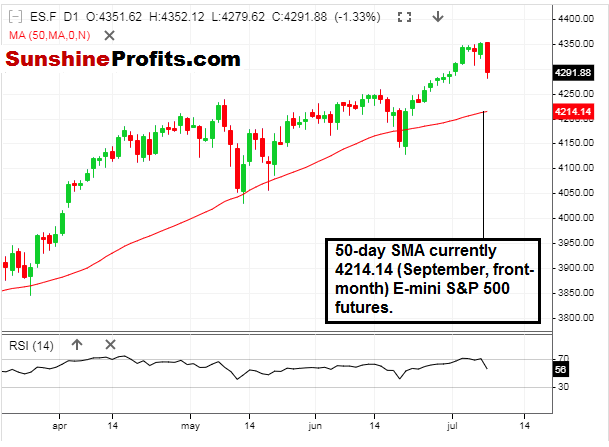
US equity futures were lower overnight ahead of the cash open with several headlines moving the market; the ECB confirms that they are raising their inflation goal to 2%, there is talk of Covid variants, and a potential spectator-free Olympic games. It is one of those mornings. To put matters into perspective, let’s take a look at a daily candlestick chart of the S&P 500.

Figure 1 - E-Mini S&P 500 Futures March 13, 2021 - July 7, 2021, 8:42 AM, Daily Candles Source stooq.com
After the slow grind higher, we finally have a meaningful pullback so far at the open today. It was hard to see that one coming, and we will find out if the pullback has any legs to it throughout the day. The 50-day SMA is still quite a distance away (4214.14), so I would not be in any rush to buy the index here, and also don’t see any reason to get emotional and sell into it, either.

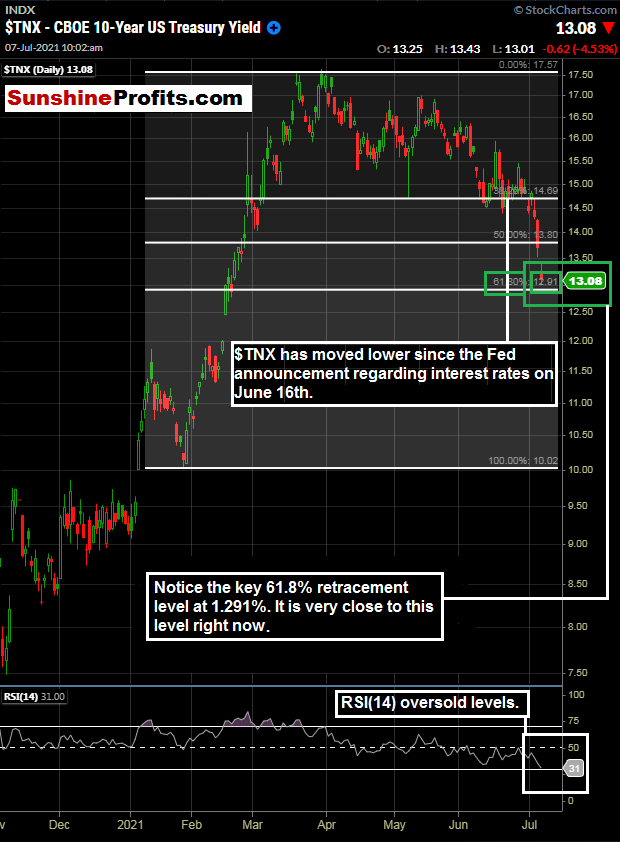
Figure 2 - Ten-Year Treasury Note Yield September 16, 2020 - July 7, 2021, 9:04 AM, Daily Candles Source stockcharts.com
It is a somewhat rough open today, with capital fleeing into Bonds (even further) and the S&P 500 opening down ~1.4%. Is rushing into buying bonds (expecting lower yields) the right thing to do right now?
I don’t think so. Taking all of the emotion out of the market, the 10-year note yields are in oversold daily territory and hitting a 61.8% retracement level, with the 200-day moving average in sight.
Yesterday, the ten-year yield gapped lower and looked like it was putting in a low, with a doji candle formation after gapping down on the session. As it turns out, today may be an even more favorable day to consider getting long interest rates in one shape, form, or fashion.
Speaking of bond yields, we examined them yesterday, and they are indeed lower again this morning. We looked at TLT, and let's take a look early this morning.

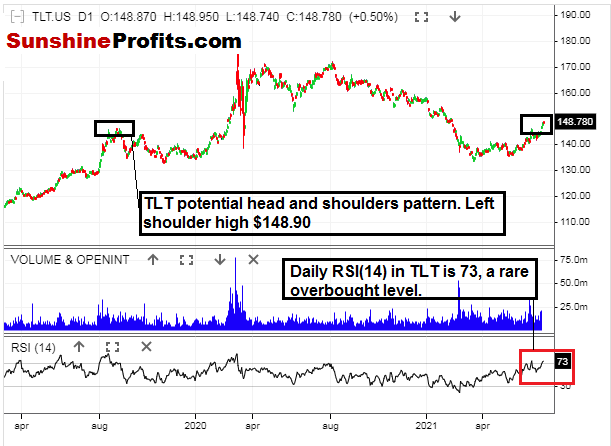
Figure 3 - TLT iShares 20+ Year Bond ETF September 10, 2018 - July 7, 2021, DailyCandles Source stooq.com
This potential head and shoulders (long-term) formation in TLT has a left shoulder high of $148.90. We are currently trading higher than this as I write this, at $149.24. It is up by 0.83% on the day so far. It is not the biggest up day in the world, but not too much fun when short from $148.00.
Emotions and trading do not mix. Today, all of the talking heads are making it sound like the sky is falling with capital moving out of stocks and into bonds. The SPX was up for eight of the last nine sessions, I believe, and the index is currently trading where it was last Monday. Is that really a big deal? That is why I love to consult the charts and technicals; there is no human emotion in there.
Another key observation: The Ten-Year note yield has not had a daily RSI(14) level this low (29) since the Covid-19 meltdown. Oversold much?
Now, let’s cover the stop loss, take profit, and other key levels in TLT, along with analyses on the other eight markets we are covering for Premium Subscribers.
Not a Premium subscriber yet? Go Premium and receive my Stock Trading Alerts that include the full analysis and key price levels.
Thank you for reading today’s free analysis. If you would like to receive daily premium follow-ups, I encourage you to sign up for my Stock Trading Alerts to also benefit from the trading action described - the moment it happens. The full analysis includes more details about current positions and levels to watch before deciding to open any new ones or where to close existing ones.
Thank you.
Rafael Zorabedian
Stock Trading Strategist -
Mid-Session Stock Trading Alert: ETF Entry Signals Triggered
July 7, 2021, 11:50 AMAvailable to premium subscribers only.
-
Interest Rates: Making the Improbable Today’s Reality
July 7, 2021, 11:05 AMThe US Federal Reserve has raised its interest rate guidance for 2023; and potentially late 2022. Oddly enough, interest rates have moved lower since the last Fed meeting.
I see an opportunity today.
You would think that the higher interest rate guidance would have created a bump higher in the $TNX (Ten-Year Note Yield). However, wouldn’t that make too much sense? The more trading experience I have gotten over the last two decades, the clearer it is, that logic doesn’t always work - unless you are early enough.
If you have been following along, you know that yesterday, I discussed the S&P Banking sector, namely KBE, as we wait for a pullback to some key technical levels.
It got me thinking: the Ten-Year Note yield should be very similar to that trade.

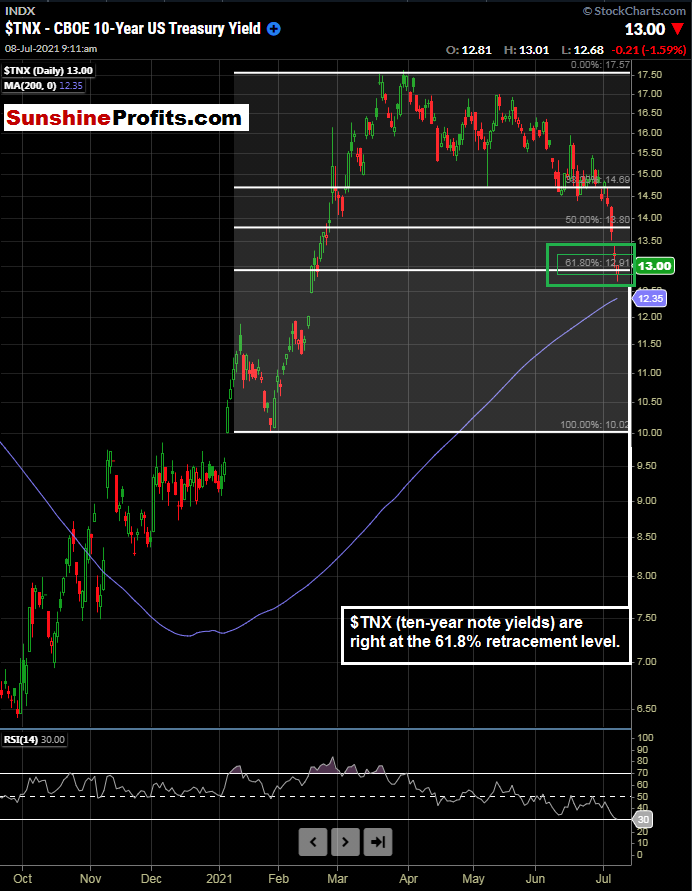
Figure 1 - Ten-Year Treasury Note Yield November 3, 2020 - July 7, 2021, 10:10 AM, Daily Candles Source stockcharts.com
We can see that the 10-year note yield has declined since June 16th’s Fed meeting. We are approaching daily oversold levels via the RSI(14). I think it is safe to say that many traders that took this trade (especially with leverage) have reached or are reaching their point of maximum pain. Notice how this chart looks very similar to the chart regarding KBE in yesterday’s publication.
Higher interest rates can create net interest margin expansion for banks and can boost the bottom line. Lower rates may have contributed to the fall in KBE over the last few weeks.
But Wait, There’s More
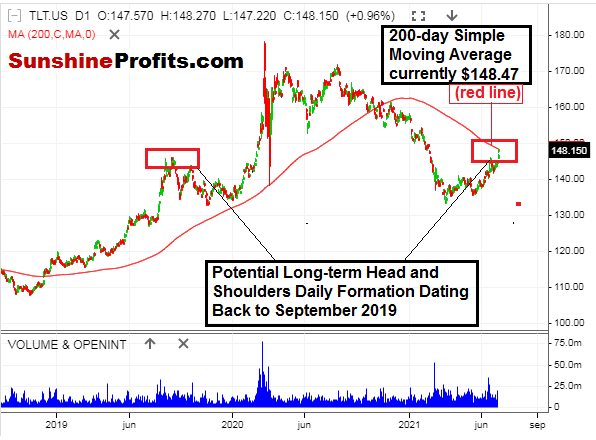
There were simply too many technical indicators to fit on one chart on this one. So, let’s take another look at interest rates, but this time in the form of TLT iShares 20+ Year Bond ETF. Let’s further out in time with daily candles here.

Figure 2- TLT iShares 20+ Year Bond ETF September 10, 2018 - July 7, 2021, DailyCandles Source stooq.com
I like the fact that numerous indicators are showing that interest rates may be due to head back in the “correct” direction. We have a long-term potential head and shoulders pattern, the 200-day moving average in TLT. We also have the key 61.8% Fibonacci retracement level in $TNX. Putting all of this together makes sense for a trade opportunity.
Perhaps since most traders that took the “logical” trade on the Fed announcement back on June 16th have had enough and reached a point of maximum pain, it can be our turn for a trade.
There are indeed numerous ways that a trader can trade interest rates. There are different products, durations, and instruments. Many traders are not familiar with interest rate futures; they are quoted differently and have margin requirements that may not be suitable for many traders.
I happen to like the TLT as the preferred instrument here. It is the longer end of the curve (20+ years) and is extremely liquid. The longer end of the yield curve can provide more price volatility versus the shorter end, and I strongly like the longer-term head and shoulders pattern that could be forming in the TLT.
Putting all of this together makes me consider Selling TLT when $TNX trades between 1.291% - 1.310% or at the 200-day near moving average of TLT ($148.47). Let's call it $148.47 - $148.00.
It looks like this TLT trade could be triggered at any time today.
Now, since we are covering so many markets, let’s cover the rest of them and see where the nine covered markets are trading for Premium Subscribers.
Not a Premium subscriber yet? Go Premium and receive my Stock Trading Alerts that include the full analysis and key price levels.
Thank you for reading today’s free analysis. If you would like to receive daily premium follow-ups, I encourage you to sign up for my Stock Trading Alerts to also benefit from the trading action described - the moment it happens. The full analysis includes more details about current positions and levels to watch before deciding to open any new ones or where to close existing ones.
Thank you.
Rafael Zorabedian
Stock Trading Strategist -
Finding Opportunity During a US Holiday Trading Week
July 6, 2021, 11:36 AMIt’s the week of the Independence Day Holiday, and that typically leads to lighter volume trade. There is little in the way of economic data this week, so let’s find some potential opportunities.
Last week’s Non-Farm Payroll data was a refreshing change of pace for market participants. As the market expected 700K jobs added during June, the market got a print of 850K. The S&P 500 moved higher on Friday, tacking on about 25 handles from the time the data was released, and the close.
It was one of those Fridays where the market was up off of economic data and just kept drifting higher. The pre-holiday trade factored in here too, and volumes seem to dry up in the afternoon. On days like that, you would have to find a very compelling reason to get long or short anything. Most professionals are closing up their books ahead of the long weekend and just wanting to be flat. Over a period of years, I came to learn that Fridays were my least productive trading days, so I personally look to be flat, and/or have only longer-term swing trades or position trades on heading into a weekend.
That is useful insight, but it is so last week. What can we find this week?
First, I want to mention that this week is a light one on the economic data front. On Tuesday, we get the ISM Services PMI (manufacturing expansion or contraction). On Wednesday, we get the FOMC meeting minutes, which could provide some additional depth to the last Fed statement. We expect a light volume, holiday-week style trading week on the major exchanges this week.
Tropical Storm Elsa
We also have Elsa - currently a Tropical Storm (and will hopefully stay that way). Trade themes tend to center around energy, insurers, orange juice during Florida storms. I am currently writing to you from the projected path of Elsa, and hopefully, it will be weaker than expected! Personally, I would be looking to fade Elsa. I somewhat kid, but did you know that you can actually trade weather?

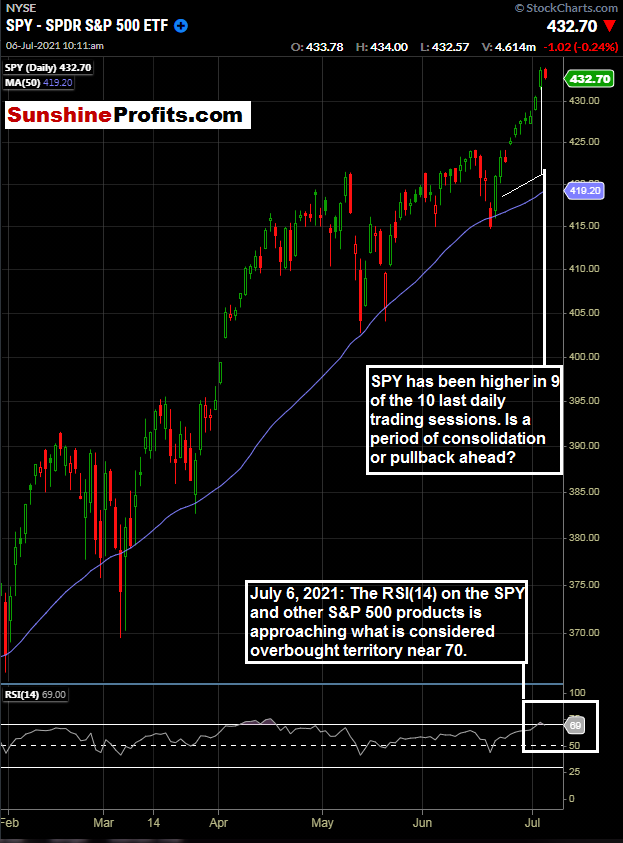
Figure 1 - SPDR S&P 500 ETF January 29, 2021 - July 6, 2021, 10:10 AM, Daily Candles Source stockcharts.com
A simple observation: The S&P 500 has been higher in nine of the ten last trading sessions. It has been unfadable and looking forward to this week on lighter volume; it may take a surprising catalyst to send the index lower in any meaningful fashion. We are approaching technically overbought levels according to RSI (14), but what could be a catalyst for substantially lower prices? Sideways consolidation could be the next theme in the short-term on light holiday week volume.
Given the expectations for the style of this week, and not wanting to chase an index higher that is approaching daily overbought levels (but not looking to get short either), we can look to particular stories and themes in order to find a potential opportunity.
Let’s Talk Banks & KBE
Now that we have the first Fed interest rate hike hint out of the way, we can think about bank stocks over the longer term. Higher interest rates can create net interest margin expansion for banks and can boost the bottom line.
Many bank stocks sold off on the Fed news initially (a buy the rumor sell the fact type trade). Now that we have pulled back a bit in the bank names, I begin analyzing ETFs for opportunities.

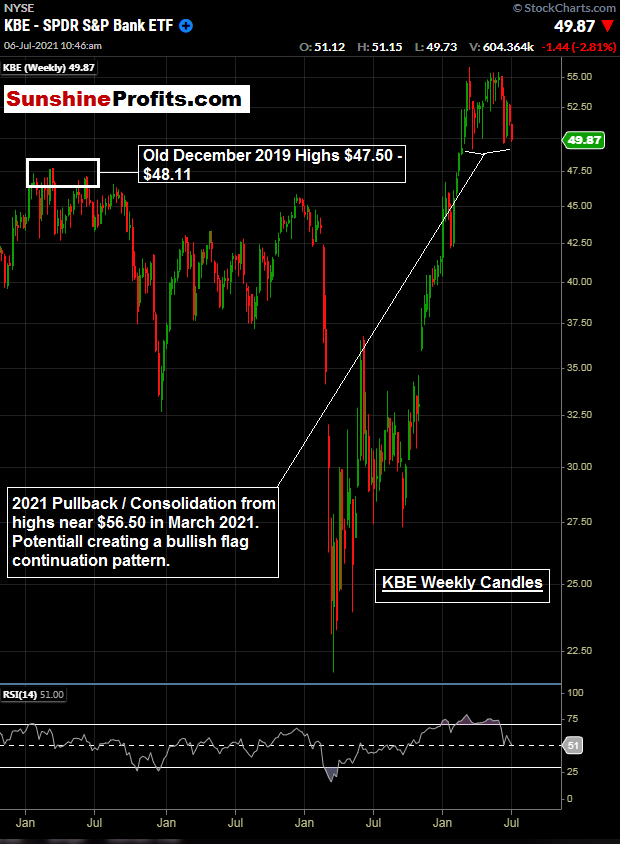
Figure 2- KBE S&P Bank ETF October 30, 2017 - July 6, 2021, Weekly Candles Source stockcharts.com
Above, we have the KBE S&P Bank ETF. You may be thinking - banks? They are so boring! The truth is I do like boring. There is a meaningful pullback off the highs in the banking sector of the S&P 500 already. We like to buy pullbacks in bull markets, right? The above chart is a weekly chart, and we can see that the price is approaching the previous highs made in late 2019 and that we are at the bottom of the most recent consolidation range.
Perhaps a quieter S&P 500 this week can provide an opportunity in an ETF that has pulled back over 9% from its 2021 highs; as the S&P 500 has continued to make new highs.
Turning to the Daily Charts:

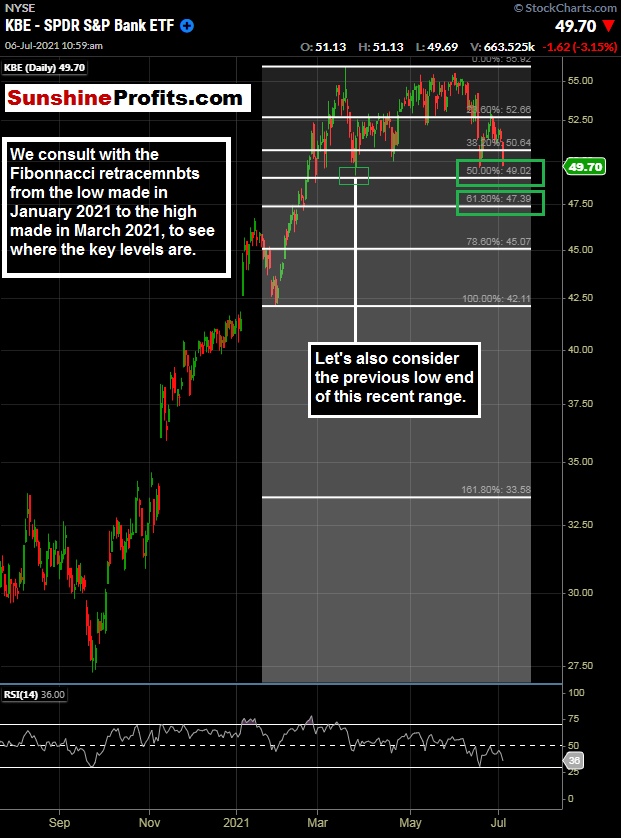
Figure 3- KBE S&P Bank ETF September 1, 2020 - July 6, 2021, Daily Candles Source stockcharts.com
We have several levels to consider here. First, we are very close to the recent low point of the consolidation range ($49.15) combined with the 50% Fibonacci retracement level of $49.02.
However, what if the broader market finally pulls back/consolidates? A move lower could give us a dip in the KBE, potentially to the 2019 highs near $48. This pullback could be soon and could coincide with a daily RSI (14) reading at oversold levels near 30 or lower.
That’s the kind of stuff I like to see, and I like having a plan in place for when it happens. I like looking at the key 61.8% retracement level of $47.39 and the 2019 highs of $48.11.
Now, since we are covering so many markets, let’s start the week off correctly and see where the nine covered markets are trading for Premium Subscribers.
Not a Premium subscriber yet? Go Premium and receive my Stock Trading Alerts that include the full analysis and key price levels.
Thank you for reading today’s free analysis. If you would like to receive daily premium follow-ups, I encourage you to sign up for my Stock Trading Alerts to also benefit from the trading action described - the moment it happens. The full analysis includes more details about current positions and levels to watch before deciding to open any new ones or where to close existing ones.
Thank you.
Rafael Zorabedian
Stock Trading Strategist
Free Gold &
Stock Market Newsletter
with details not available
to 99% investors
+ 7 days of Gold Alerts
Gold Alerts
More-
Status
New 2024 Lows in Miners, New Highs in The USD Index
January 17, 2024, 12:19 PM -
Status
Soaring USD is SO Unsurprising – And SO Full of Implications
January 16, 2024, 8:40 AM -
Status
Rare Opportunity in Rare Earth Minerals?
January 15, 2024, 2:06 PM

