

-
Inflation Nation: Pressure Builds, Underwater Beach Ball
July 19, 2021, 12:00 AMLast week’s excessive CPI print marked the top of the S&P 500 for the week. As the market continues to digest the data, where is the breaking point for inflation and interest rates?
Did you watch Fed Chair Powell testify in front of the Senate and House last week? It seemed to be like watching certain angry congresspeople calling for interest rates to be kept lower for longer. Do they want hyperinflation? Other groups of Senators reflected on what the inflationary environment was like in the early 1980s.
As Chair Powell testified, bonds rose (yields fell), and the S&P 500 was mostly lower. Clearly, there was a bid under the bonds (keeping interest rates lower). All of this came over a two-day period following the monstrous CPI print.
Recapping Tuesday through Friday in the E-Mini S&P 500 Futures Last Week:

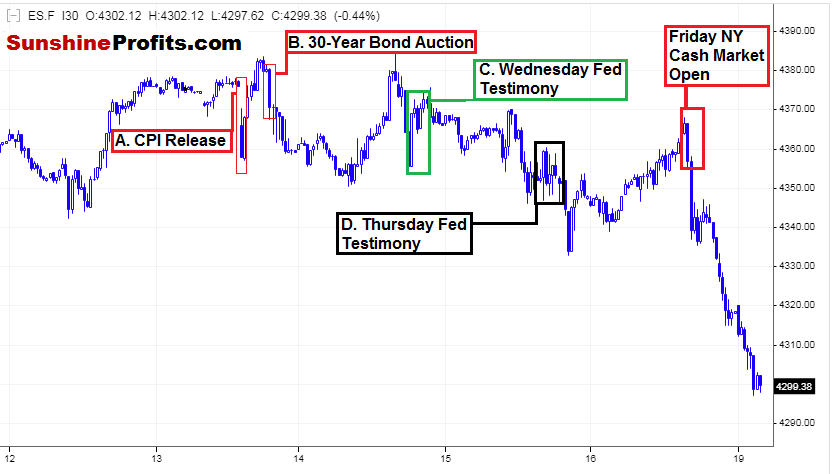
Figure 1 - E-Mini S&P 500 Futures July 12, 2021 - July 16, 2021, 10:00 PM ET, 30 Minute Candles Source stooq.com
A. Tuesday 8:30 AM: CPI Data 0.9% vs. 0.5% expected, highest run rate ex-food and energy in 30 years.
B. Tuesday 1:00 PM: Weak 30-Year bond auction offered at 2.00% yield
C. Wednesday: Fed Chair testimony
D. Thursday: Fed Chair testimony
E. Friday: NY Cash Market Open
We can see the large CPI print was bearish for the index, and the market recovered. Then, we had the bond auction, which had very weak demand at 2.00%, and the index sold off again. It recovered once again, tested the highs, and was rejected. The Fed testimonies on Wednesday and Thursday kept the S&P 500 bid and sideways.
As all of this was occurring last week, I was eyeballing the index all day, each day, wondering when it would all become too much to keep the index afloat.
On Friday, we got a bullish Retail Sales number at 8:30 AM before the NY cash open, and then a bearish UoM Consumer Sentiment Print at 10:00 AM. The NY open was lower even before the bearish UoM print at 10:00 AM. It seemed like the index finally couldn’t bear the inflation data. The weak bond auction, and the congressional rhetoric during the Fed 2-day testimony any further and had to break. It actually made sense.
I want to illustrate the above A through E points in terms of interest rates last week.
Taking a look in terms of the 10-Year note yield:

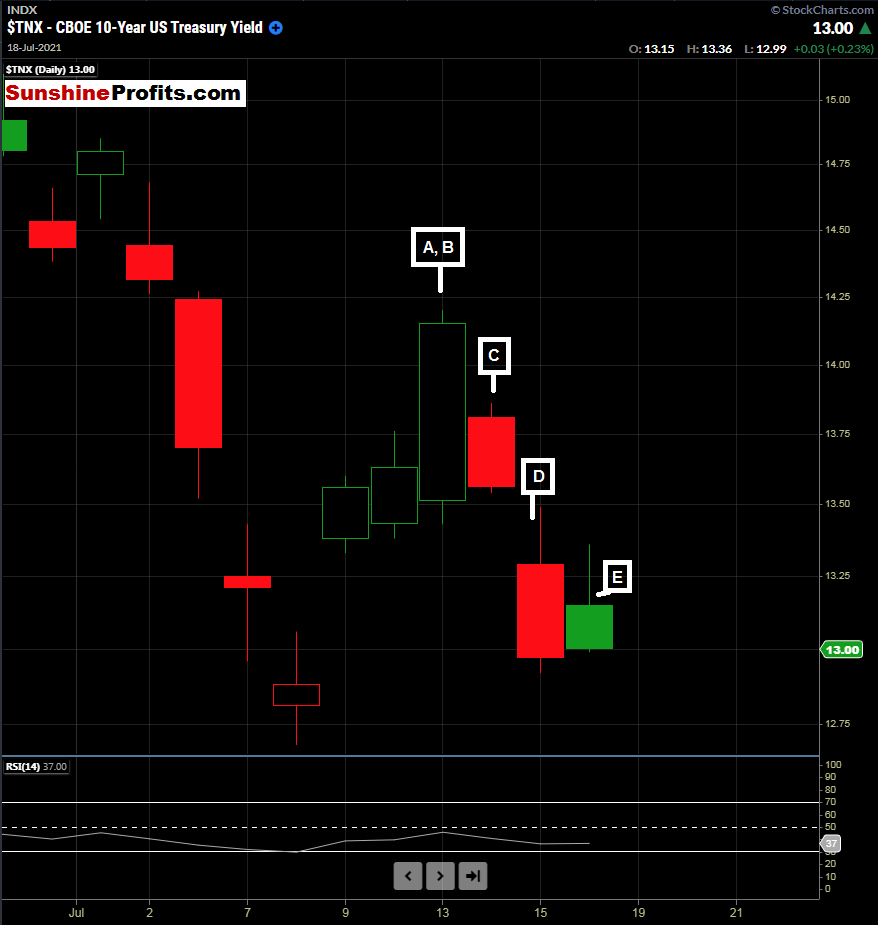
Figure 2 - 10-Year Treasury Yield July 12, 2021 - July 16, 2021, Daily Candles Source stockcharts.com
The question I pose here: What if interest rates were rising towards the end of last week?
It doesn’t seem like the current market would be able to handle it. However, the Fed must use tools to curb inflation. This inflation seems anything but transitory or temporary at this point.
If bond yields were going higher on Friday with the market lower, how much would the INdex have dropped? That is the million-dollar question.
Rates do need to rise. But, if the Fed is not going to begin tapering (slowing bond purchases) or raising rates incrementally, what will happen with inflation?
If you hold a beach ball underwater, it eventually will pop up. You can’t keep it underwater forever.
This is food for thought as we begin the week.
Now, let’s cover all nine markets we are following for Premium Subscribers.
Not a Premium subscriber yet? Go Premium and receive my Stock Trading Alerts that include the full analysis and key price levels.
Thank you for reading today’s free analysis. If you would like to receive daily premium follow-ups, I encourage you to sign up for my Stock Trading Alerts to also benefit from the trading action described - the moment it happens. The full analysis includes more details about current positions and levels to watch before deciding to open any new ones or where to close existing ones.
Thank you.
Rafael Zorabedian
Stock Trading Strategist -
Bond Yields Slipping, How Long Can Inflation Be Transitory?
July 15, 2021, 2:02 PMSince the big CPI and PPI prints earlier this week, markets have been trying to figure out direction and sentiment. What will be the outcome of continued higher inflation prints?
Capital markets seem to be a bit confused as to what to do next. As Federal Reserve Chair Powell testified in front of House and Senate committees over the last two days, there doesn’t seem to be any additional clarity in my eyes.
I wanted to wait until the Fed’s 2-day testimony concluded before publishing today’s opinion piece to gain any additional clarity on the markets.
There is a conundrum that exists right now. We keep getting higher inflation readings, and the Fed has already telecasted that higher rates are in the cards in 2023 (maybe 2022). Inflation is a problem and needs to be tamed. One way of taming it is to raise interest rates. There are other tools at the Fed’s disposal to tame interest rates like tapering and more. The question becomes, at what point is action going to be taken?
As the Fed testified in Congress yesterday and today, interest rates fell and the price action seemed anything but typical following Wednesday’s poor 30-year bond auction. We get it, the markets are addicted to low interest rates, but unless hyperinflation is the goal, it feels like something needs to change soon. When will the Fed begin tapering bond buying? How about some incremental tapering or very fractional interest rate increases such as an eighth of a percentage point or something? If something doesn’t change soon, we could be heading for a 1981 style inflationary environment. Rates are going to have to rise, and the stock market is not going to like it. However, action needs to be taken.
Will the US equity markets be able to maintain their upward trajectory?
All of this stimulus, decade-plus near-zero interest rates, bond buying, and market addiction to easy monetary policy will have repercussions eventually.
Since we have been analyzing TLT, let’s take a look at the 30 Year Bond Futures:

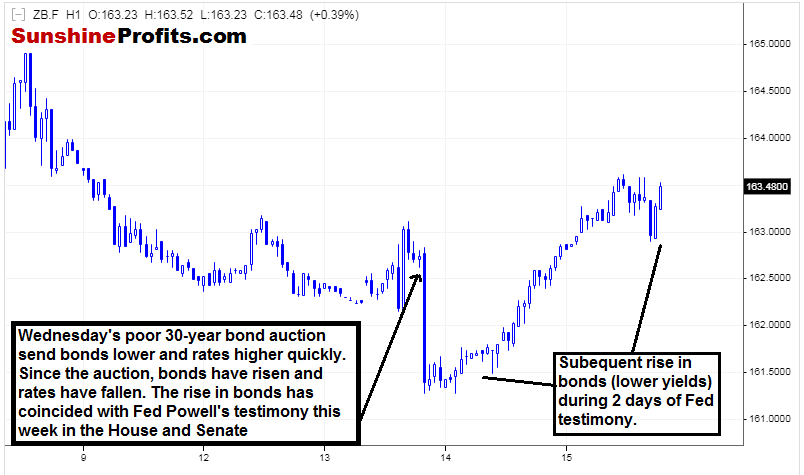
Figure 1 - U.S. Treasury Bond Futures July 8, 2021 - July 15, 2021, 1 Hour Candles Source stooq.com
The puzzling price action (or perhaps not so puzzling in retrospect given the 2-day Fed testimony) is the creep higher after the weak demand shown in Wednesday’s 30-year bond auction. If you were short bonds at this time via TLT or any product, things were looking good. Since that auction, we had the Fed testimony, which showed many select congress members pleading for interest rates to be kept low. Unfortunately, if rates remain at rock bottom levels, it seems like inflation could spiral out of control. This continued inflation would be bad for the American people.
It is unusual price action; to say the least. The 30-year bond auction was priced at 2%, and demand was extraordinarily weak. There is a solid explanation of this most recent bond auction on Barrons.
However, today, we have 30-year bonds catching a bid near 1.94%. Yes, it is illogical. Yes, markets can be illogical for extended periods.
Looking at the 30-year bond from a perspective of yield:

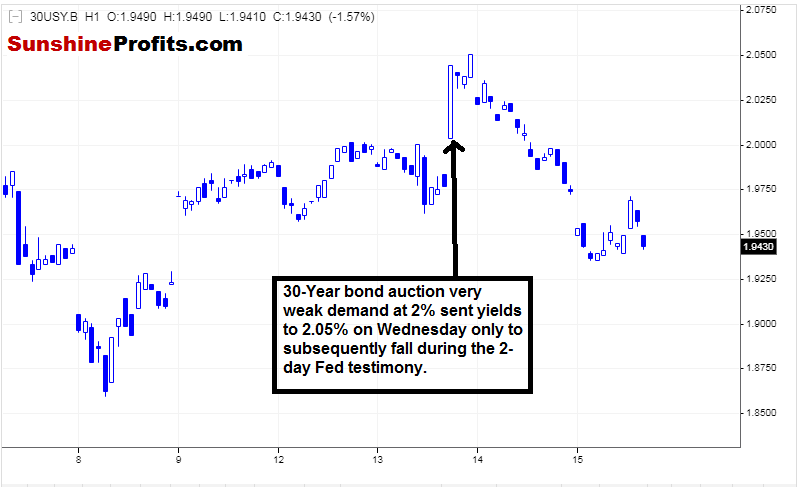
Figure 2 - U.S. 30 Year Treasury Bond Yield July 7, 2021 - July 15, 2021, 1 Hour Candles Source stooq.com
Fed’s James Bullard, Federal Reserve Bank of St. Louis President urged for tapering of bonds earlier today.
At the time of writing, we have the bonds continuing to be bid with the $SPX moving lower. The message of the market is exhibiting signs of change in my eyes. I don’t want to sound any overall warning bells just yet, but I am tuned in all day, every business day.
Now, let’s review the markets we are monitoring along with analyses on the other seven markets we are covering for Premium Subscribers.
Not a Premium subscriber yet? Go Premium and receive my Stock Trading Alerts that include the full analysis and key price levels.
Thank you for reading today’s free analysis. If you would like to receive daily premium follow-ups, I encourage you to sign up for my Stock Trading Alerts to also benefit from the trading action described - the moment it happens. The full analysis includes more details about current positions and levels to watch before deciding to open any new ones or where to close existing ones.
Thank you.
Rafael Zorabedian
Stock Trading Strategist -
Intraday TLT / Bond Analysis, Fed Chair Powell Imminent
July 14, 2021, 12:04 PMAvailable to premium subscribers only.
-
Big CPI Data, Bank Earnings Beat Expectations, Mixed Sectors
July 13, 2021, 12:48 PMToday’s CPI release is in focus as inflation doubles expectations. Tech is leading in morning trade today in New York.
Bank earnings were strong this morning; with JP Morgan Chase (JPM) and Goldman Sachs (GS) having big beats versus analyst expectations. These strong earnings results are being overshadowed mid-session with yet another giant print in CPI data.
Giant CPI Data Print
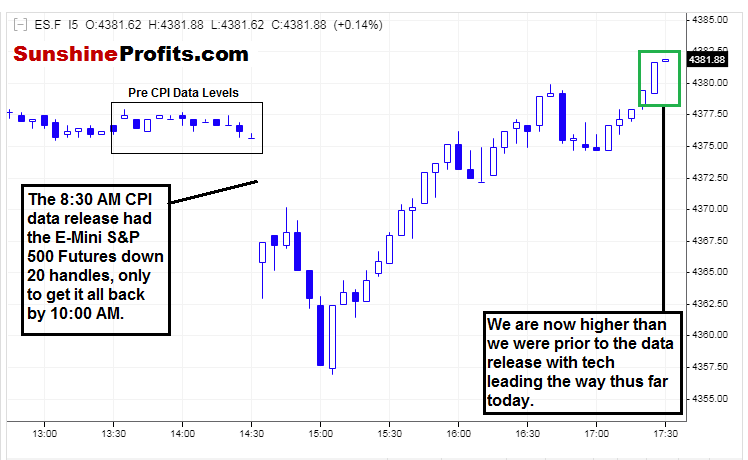
This morning, the market consensus was for a CPI print of 0.5%, but yet again, we got a huge number at 0.9%. This level is the highest since 2008 and has seemed to put a cloud over today’s trade in New York. The S&P 500 is essentially flat so far today, after dipping 20 handles on the 8:30 AM data release and recuperating all of the CPI news release losses by 10:00 AM. It is one of those kinds of trading sessions so far, but we still have several hours to go today. Tech continues to be strong today, with many individual names lighting up green on the screen. Is the tech trade getting somewhat crowded at these levels?

Figure 1 - E-Mini S&P 500 Futures (September Contract) July 12, 2021 - July 136, 2021, 5 Minute Candles Source stooq.com
Cash traders wouldn’t even know the movement took place.
As today progresses, it feels like the market is digesting the monster CPI print and where capital will be allocated going forward. Interest rates initially fell hard off the data release; but have since been climbing back intraday, as the $SPX has been gaining a little bit of some steam.
There is no question that the S&P 500 is in full resilience mode here. Shaking off the large CPI prints without hesitancy and resuming the upside tells us a story. What the end result of that story is going to be is still up for interpretation. As more time passes and more digestion occurs, the picture will become clearer.
At times like this, I like to allow the data to be digested before making new decisions. This reflection period allows time to manage perspective and outlook on existing opinions/positions.

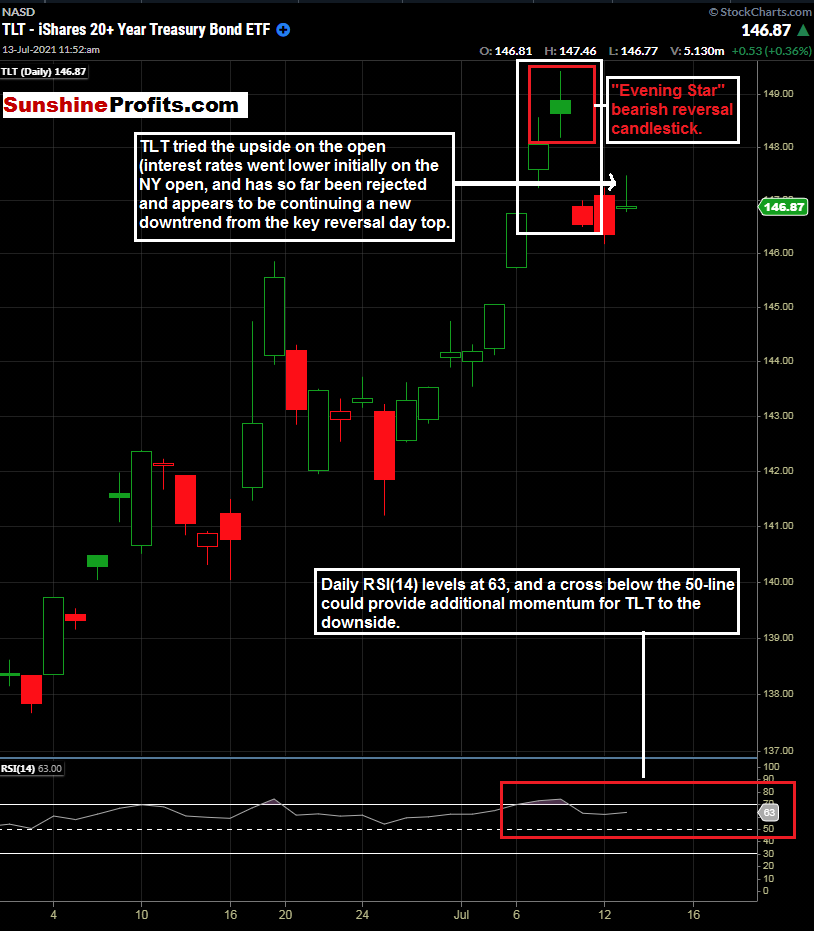
Figure 2 - TLT iShares 20+ Year Bond ETF June 1, 2021 - July 13, 2021, Daily Candles Source stockcharts.com
It is starting to look more and more that we have experienced a key reversal day in TLT and interest rates. The candle formation July 7th - 9th resembles an “Evening Star” formation, and the uppermost candle on July 8th looks like it marks a short-term top.
An evening star formation is a bearish reversal pattern that continues an uptrend with a long green (up)body day followed by a gapped up small body day, then a down close with the close below the midpoint of the first day.
If you are looking to beef up your candlestick knowledge, I highly suggest checking out ChartSchool on Stockcharts. It has been a valuable resource for 20 years and continues to be an excellent reference and knowledge resource.
Right now, let’s see how the remainder of the session plays out given the big bank earnings results so far; and the large CPI data print.
I still like the idea of staying long the banks and short bonds (higher interest rates) at this time.
Now, let’s examine the nine markets that we are covering for Premium Subscribers.
Not a Premium subscriber yet? Go Premium and receive my Stock Trading Alerts that include the full analysis and key price levels.
Thank you for reading today’s free analysis. If you would like to receive daily premium follow-ups, I encourage you to sign up for my Stock Trading Alerts to also benefit from the trading action described - the moment it happens. The full analysis includes more details about current positions and levels to watch before deciding to open any new ones or where to close existing ones.
Thank you.
Rafael Zorabedian
Stock Trading Strategist
Free Gold &
Stock Market Newsletter
with details not available
to 99% investors
+ 7 days of Gold Alerts
Gold Alerts
More-
Status
New 2024 Lows in Miners, New Highs in The USD Index
January 17, 2024, 12:19 PM -
Status
Soaring USD is SO Unsurprising – And SO Full of Implications
January 16, 2024, 8:40 AM -
Status
Rare Opportunity in Rare Earth Minerals?
January 15, 2024, 2:06 PM

