

-
Fed Dot Plot Changes. US Equities Lower Post-FOMC Statement.
June 16, 2021, 9:19 PMIs the Fed moving too quickly? Can the equity markets handle a Fed taper without the tantrum? What about inflation? Yesterday’s FOMC statement creates more questions than answers.
So, we now know that the Fed expects to hike interest rates in 2023.
That could be ok. However, there was some contradictory language yesterday surrounding inflation. Is it transitory in the eyes of the Fed, or is it something more? Yesterday’s press conference seemed to play both sides of this coin, and stocks sold off on the uncertainty.
That’s ok too.
In reality, the selloff wasn’t too bad, with the $SPX losing 0.54%; and the $VIX rising by 6.64% on Wednesday. The benchmark 10-year yield $TNX tacked on 4.67% and finished yesterday’s session at a 1.568% yield. There was a pocket of strength in financial names and a few select market sectors. However, it makes me wonder, will asset managers be taking a different view on equities going forward? 2023 is a long time from now, but the idea of the punch bowl being taken away combined with an uncertain inflationary environment could paint a different picture going forward. We just don’t know yet.
Fortunately, some of the ETFs that we have been following fared well on Wednesday. Strength surfaced in solar and green names, which shows that we are on the right path, as capital had to make its way into something other than cash, financials, and volatility yesterday.

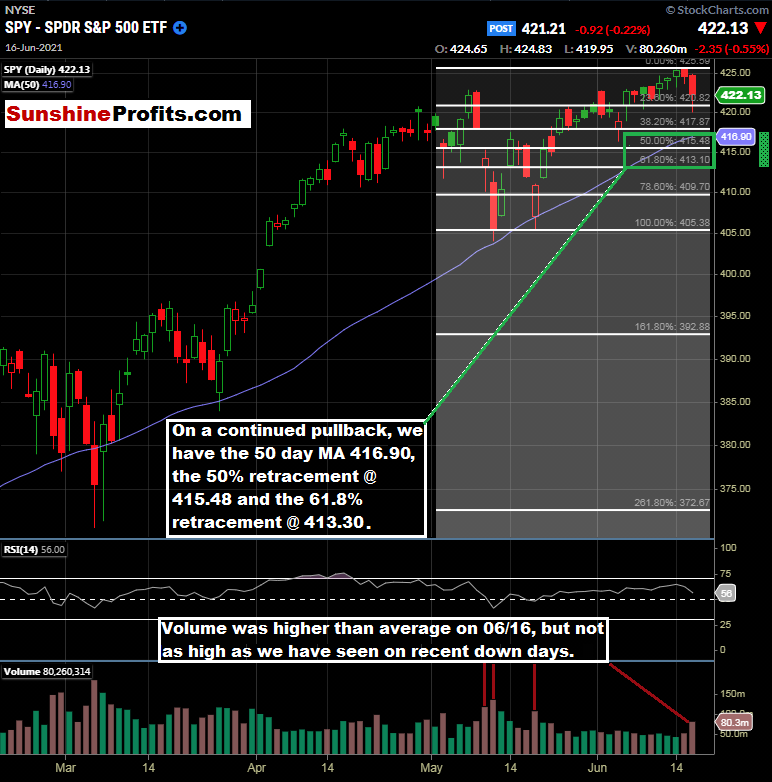
Figure 1 - SPDR S&P 500 ETF February 17, 2021 - June 16, 2021, Daily Source stockcharts.com
So, even though it seemed like the sky was falling if you were watching business news coverage after the Fed statement, it was just a pedestrian down day on decent down volume. For SPY traders that have been waiting for a pullback, there could be an opportunity in the cards soon; if we get some follow-through selling. However, I personally favor the IWM at this time, as discussed thoroughly in the May 27th publication.
Turning bearish of an event like today usually turns out to be the wrong move, in my experience. So what, rates will go up in 2023. They have to go up at some point; there is plenty of warning and plenty of time between now and then. Buying the pullback would still be the prudent move based on probabilities (it is still a bull market).
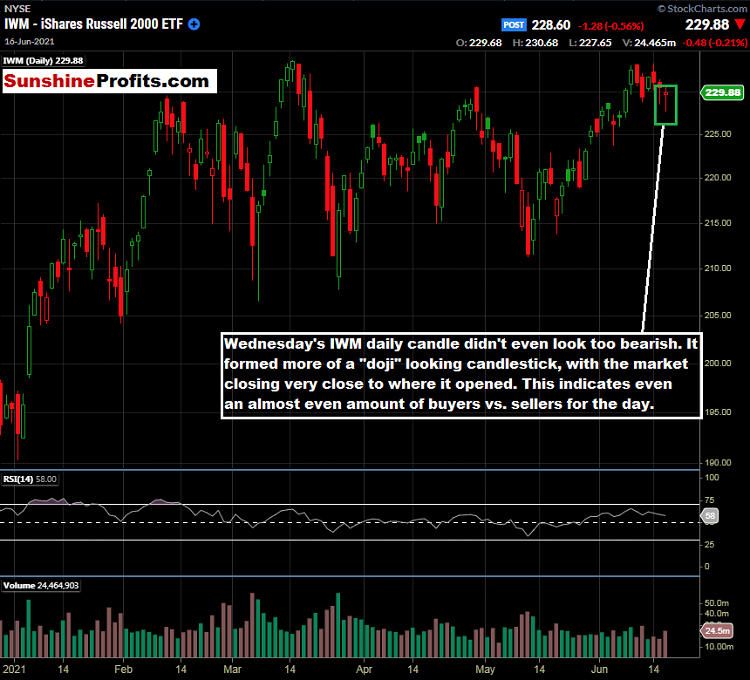
Speaking of the IWM, it fared better than the SPY in Tuesday’s session, giving up only 0.21%. It could be due to the reconstitution theme that we have been discussing.

Figure 2 - iShares Russell 2000 ETF December 29, 2020 - June 16, 2021, Daily Candles Source stockcharts.com
That is a pretty healthy daily candle for the type of session that the major indices experienced on Wednesday.
So, keeping the above in mind, is it really prudent to suddenly get bearish on the indices based on the Fed guidance towards rate hikes in 2023? Probably not. At least not today, anyway. Bull markets like this don’t just go out with a whimper on most occasions. Let’s see how things transpire across the major indices once the new Fed guidance is digested by market participants.
Now, for more bearish folks, I’d like to turn our attention to the IWM/SPY ratio that we discussed in our May 27th publication surrounding the Russell 2000 reconstitution trade.

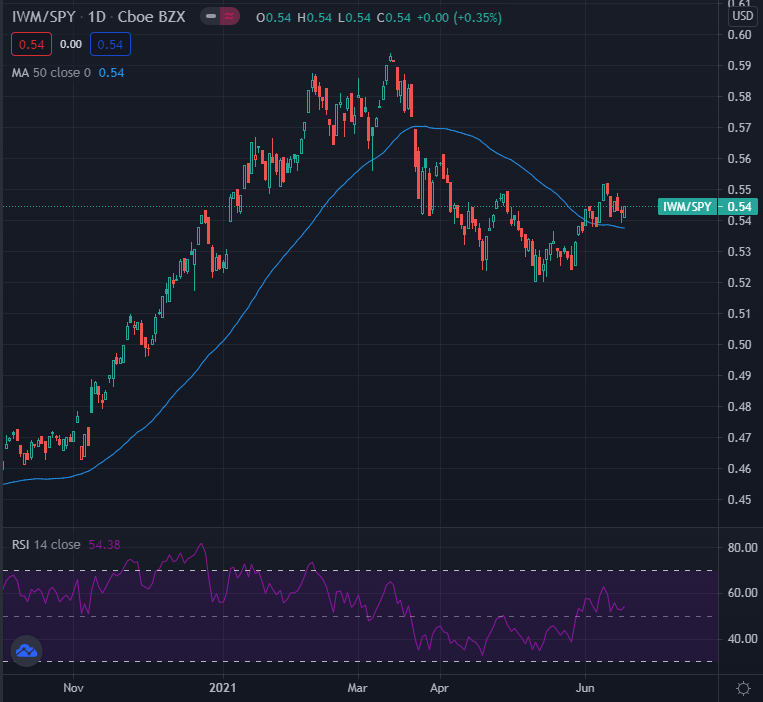
Figure 3 - IWM iShares Russell 2000 ETF / SPY S&P 500 ETF Ratio August 27, 2020 - May 26, 2021. Source tradingview.com
While the spread hasn’t moved too much to the upside since May 26th, it has tacked on a penny, moving from 0.53 to 0.54. Percentage-wise, there is nothing wrong with that, and this is a theme that could continue to work through June 28th. This trade is long the IWM and short the SPY.
While it may be too early to tell how the broader markets will react to the Fed’s change in stance, it is also not necessarily a time to make rash decisions. Looking for pullbacks when more emotional traders decide to short the market could be a good idea. For now, we will see how Asia and Europe digest the message of the Fed in the overnight session followed by another US trading session. Time will give us more clues regarding the market’s interpretation of the Fed.
Now, for our premium subscribers, let's look at what was working, even in yesterday’s down session (a few of the ETFs we have been analyzing were green on the day). There are also more buy idea levels that could be triggered soon. Not a Premium subscriber yet? Go Premium and receive my Stock Trading Alerts that include the full analysis and key price levels.
Thank you for reading today’s free analysis. If you would like to receive daily premium follow-ups, I encourage you to sign up for my Stock Trading Alerts to also benefit from the trading action described - the moment it happens. The full analysis includes more details about current positions and levels to watch before deciding to open any new ones or where to close existing ones.
Thank you.
Rafael Zorabedian
Stock Trading Strategist -
Stock Trading Update: Ahead of the FOMC Statement
June 16, 2021, 11:56 AMAvailable to premium subscribers only.
-
What’s Your Trade Ahead of the Fed? Wooden Opportunity?
June 16, 2021, 4:56 AMUS equity markets sold off a bit in Tuesday’s session ahead of today’s FOMC statement. What is your plan?
Major US equity indices traded lower ahead of the Fed meeting, and the debate over growth versus value stocks continues. Is there any magic language or policy stance that can come out of today’s Fed meeting to provide clarity in this market?
PPI data came out stronger than expected yesterday. This data adds more fuel to the inflationary theme, while Retail Sales were weak. The markets should have been lower from this data, and they were, albeit slightly.
As the anticipation builds to today’s FOMC statement at 2:00 PM ET today and the subsequent press conference at 2:30 PM ET, it seems like a good time to revisit a market that we are following - lumber.
If you have been following along and read the June 9th publication, you know that we are eyeballing the lumber markets for an ETF trade possibility. While the lumber market has been just insane to the upside in 2021, it has recently pulled back substantially. The question remains: are these higher lumber prices sustainable? If so, is there a way to participate via an ETF?
While this may seem like an obscure sector or at least an underappreciated one, let’s take a look at the front-month lumber futures to get caught up on the most recent price action.

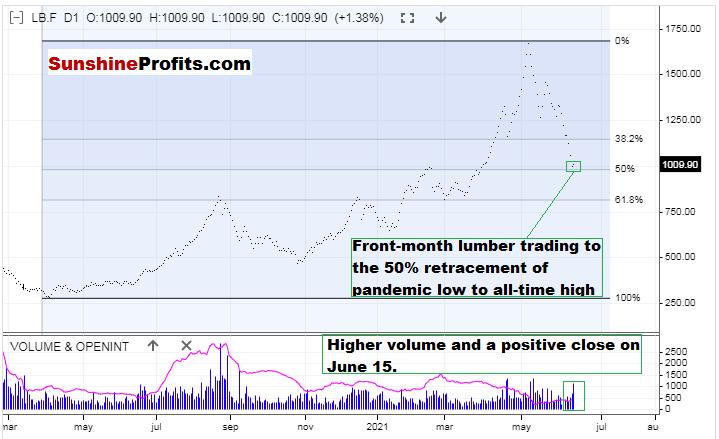
Figure 1 - Random Length Lumber Futures Continuous Contract February 21, 2020 - June 15, 2021 Daily Source stooq.com
Front-month lumber futures made a pandemic low of 251.50 on April 1, 2020. Its recent and all-time high is 1733.30, which was put in on May 10, 2021. Taking a 50% retracement of this move, we have a value of 992.40. Yesterday’s low in front-month lumber futures was 943.70 and a close of 1009.90. Yesterday’s trading was also on higher than average volume. It is important to note that it traded below the psychologically important level of 1000, through the 50% Fibonacci retracement, and then reversed intraday and closed higher. This kind of price action really gets me going.
Let’s also illustrate this price action described above via weekly candlesticks:

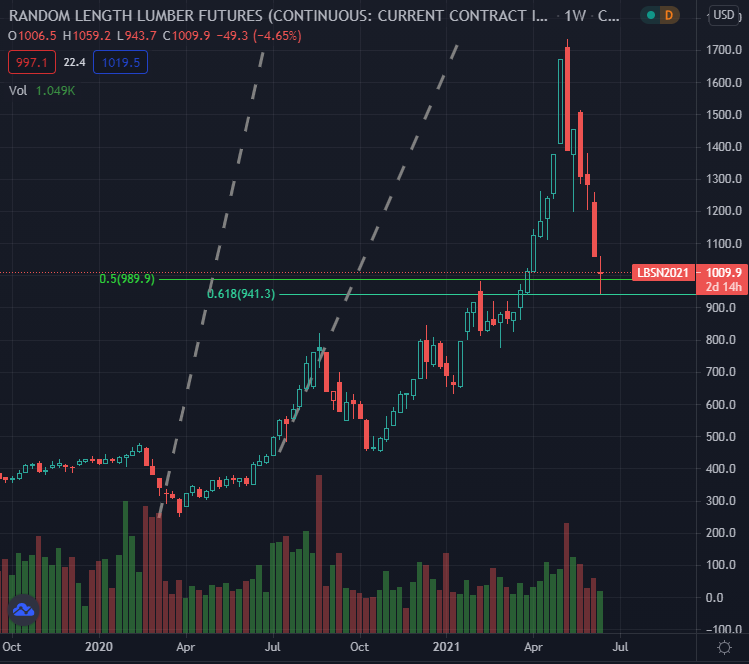
Figure 2 - LBS1! Random Length Lumber Futures Continuous Contract September 2019 - June 2021 Weekly Candles Source tradingview.com
Isn’t that something? I wanted to illustrate this via the weekly candlesticks to add a little more clarity. The weekly candlestick that is being formed this week could be a sign of things to come. Now before we go any further:
I strongly suggest against trading in Lumber Futures. They can be illiquid, and experience many limit up and limit down days. You could be stuck in a losing position and not be able to get out. The only traders in Lumber futures should be hedgers that are in the wood business or deep pocket institutional traders that have real money to burn. Futures trading entails unlimited risk. I am sure that many fortunes have been made, and many more have been lost during this insane lumber market. Being on the wrong side of a futures market like Lumber can be brutal.
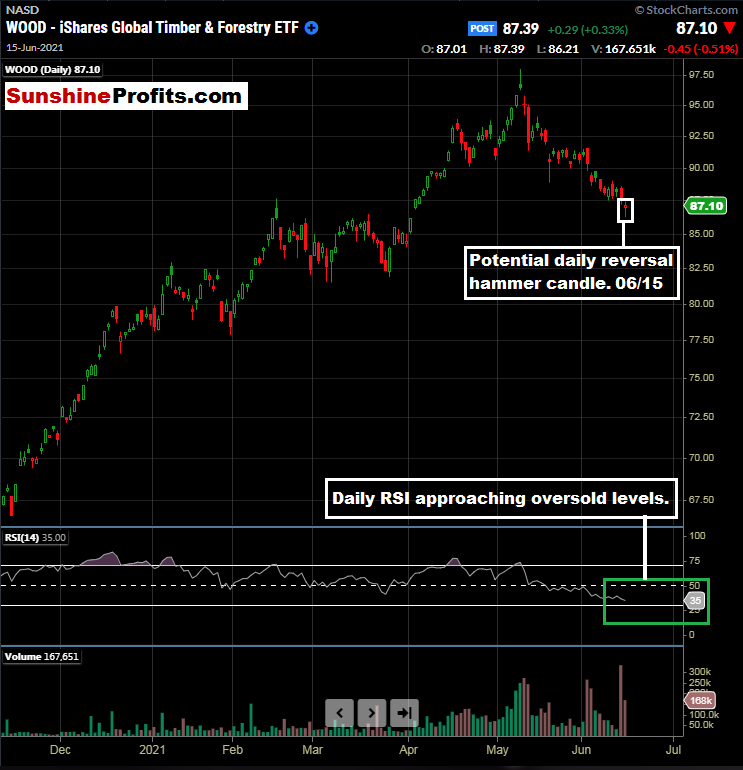
Lumber is a very thin contract and may only trade a few hundred contracts per day. But with such intriguing technicals, I want to circle back to an ETF that we covered in the June 9th publication: WOOD iShares Global Timber & Forestry ETF.

Figure 3 - iShares Global Timber & Forestry ETF (WOOD) Daily Candles November 10, 2020 - June 15, 2021. Source stockcharts.com
So, we see some interesting potential weekly candlestick formation in the Lumber futures and an interesting daily candle in WOOD. While the 2 instruments do not trade a perfect or near-perfect correlation, a correlation exists.
I like the idea of getting long the WOOD ETF based on the action in the Lumber futures markets.
While trying to catch a falling knife can be a precarious proposition, I view this as buying a pullback in a bull market. While we discussed certain levels in the June 9th publication, I would like to explore some different levels and a potential scaling/tranche entry strategy today.
And, while the price of gold certainly hasn’t caught an inflation bid (at least not yet), this could be a wooden opportunity. Maybe a wooden opportunity is the new golden opportunity.
Now, for our premium subscribers, let's look to pinpoint potential entry levels in WOOD, and recap the eight other markets that we are covering. Not a Premium subscriber yet? Go Premium and receive my Stock Trading Alerts that include the full analysis and key price levels.
Thank you for reading today’s free analysis. If you would like to receive daily premium follow-ups, I encourage you to sign up for my Stock Trading Alerts to also benefit from the trading action described - the moment it happens. The full analysis includes more details about current positions and levels to watch before deciding to open any new ones or where to close existing ones.
Thank you.
Rafael Zorabedian
Stock Trading Strategist -
Stock Trading Update: Heading into the Opening Bell
June 15, 2021, 8:46 AMAvailable to premium subscribers only.
Free Gold &
Stock Market Newsletter
with details not available
to 99% investors
+ 7 days of Gold Alerts
Gold Alerts
More-
Status
New 2024 Lows in Miners, New Highs in The USD Index
January 17, 2024, 12:19 PM -
Status
Soaring USD is SO Unsurprising – And SO Full of Implications
January 16, 2024, 8:40 AM -
Status
Rare Opportunity in Rare Earth Minerals?
January 15, 2024, 2:06 PM

