

-
The ETF You Want for Sunny and (Potentially) Cloudy Days
June 15, 2021, 1:52 AMAre you getting frustrated waiting for a meaningful pullback in US equity ETFs? There have been pullbacks in some sectors if you know where to look.
If you like to buy on pullbacks in bull markets (like me), you may have trouble swallowing some of the price levels and medium-term overbought technicals on many instruments right now.
Digging deeper into the trenches, some areas have had meaningful pullbacks, and we are going to get into one ETF right now that is currently trading at/near key technical levels.

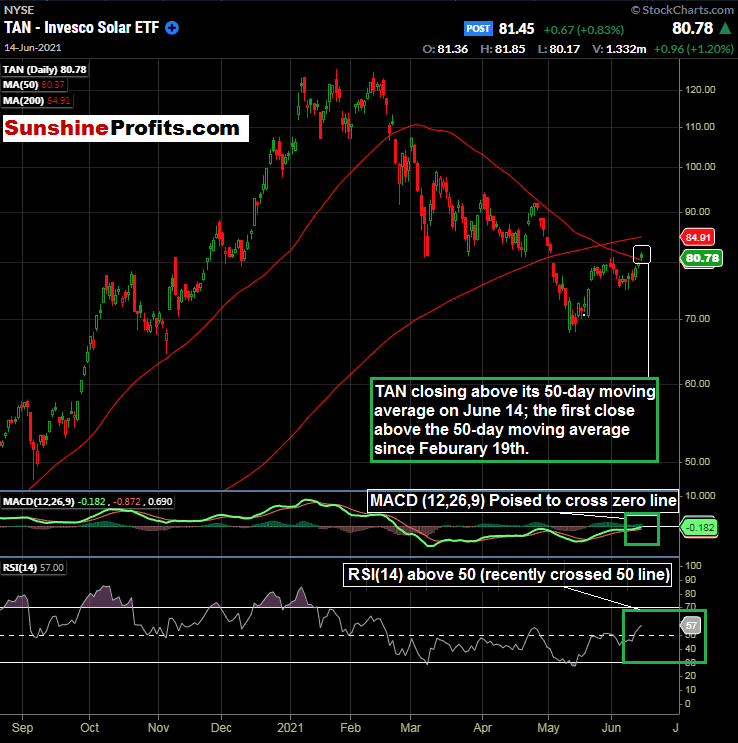
Figure 1 - Invesco Solar ETF (TAN) August 21, 2020 - June 14, 2021, Daily Candles Source stockcharts.com
I like to find bullish short to medium-term technicals, and the Invesco Solar ETF (TAN) just closed over its 50-day moving average yesterday. This technical action comes after a period of retracement and consolidation that dates back to the beginning of 2021. Its 52-week high close is $121.94, put in back on February 9, 2021.
The TAN ETF strategy and top holdings can be viewed here.
So, while everyone is still talking about inflation and the upcoming Fed decision, we can focus our attention on an ETF that has pulled back nicely over a four + month time period and is exhibiting some signs of bullish technical strength. Also, take note of the RSI above 50 (57) and the MACD poised to cross the zero line.
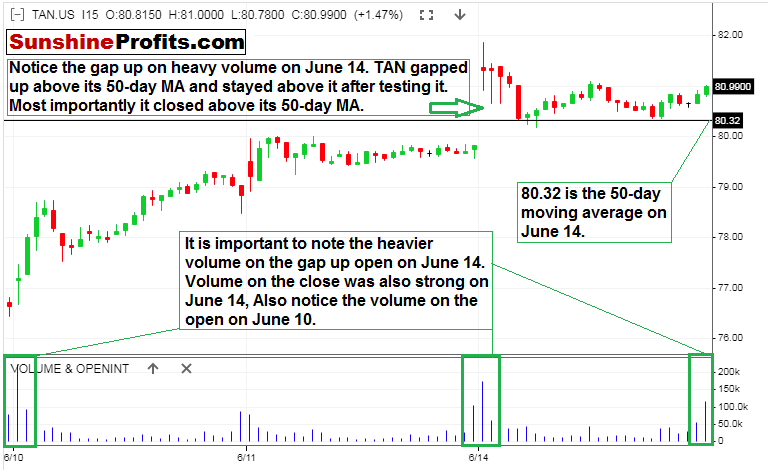
We can see that June 14th's candle was a gap higher and a close above the 50-day moving average. More clarity can be obtained by viewing an intraday 15-minute chart:

Figure 2 - Invesco Solar ETF (TAN) June 10, 2021 - June 14, 2021, 15 Minute Candles Source stooq.com
The gap-up volume and TAN’s ability to stay above and close above its 50-day moving average could be a bullish signal.
US Administration and Solar Outlook
Just like some of the other markets that I am currently following, TAN seems to make sense given the current US administration and democratic congressional majority. In fact, just as I am writing this, Reuters published an article about first-quarter US solar installations soaring. I do wish that this article would come out later instead, but it is out now.
Although there are some supply chain concerns in solar right now (think commodities), there ought to be many initiatives and subsidies put forth by the Biden administration in the coming years. Regardless of your personal opinion on solar vs. fossil fuels, the idea is to try to profit from economic conditions. TAN could be a great addition to holdings to get exposure from a sector that has already experienced a meaningful pullback; brought on partially by the buy the rumor, sell the fact type of trading action that we saw in TAN from November 2020 (US presidential election) and January 2021 (inauguration).
Based on the technicals that we have covered above and the pullback/consolidation that we have seen in the medium-term in TAN, this seems like a potentially solid entry point area.
For additional details on the US Solar Market, the SEIA (Solar Energy Industries Association) just released their Q2 2021 report. You can view it here. It contains numerous datasets, charts, and other data, including projected residential and commercial installation projections.
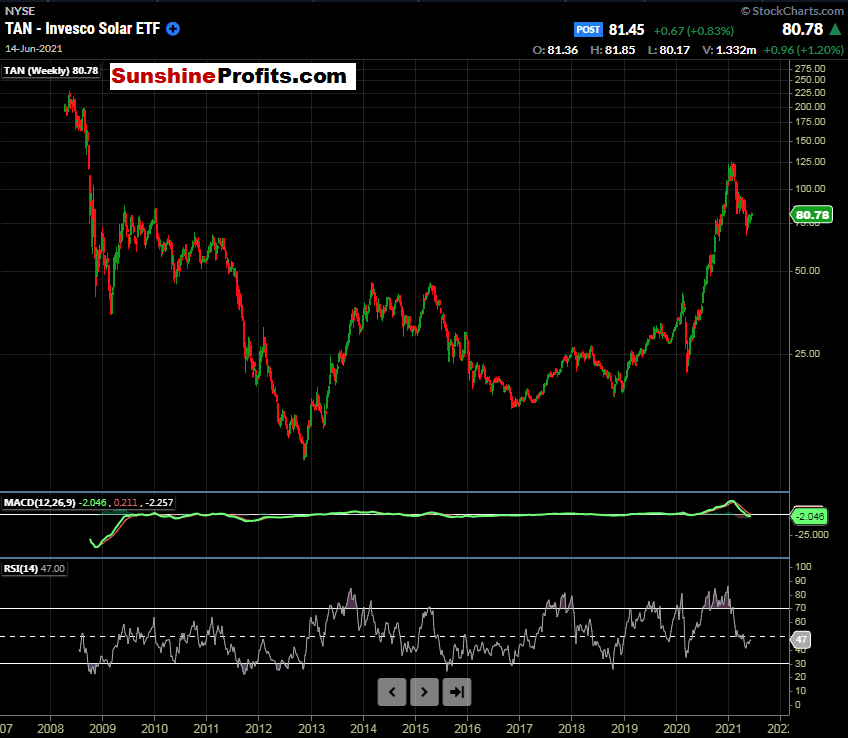
Figure 3 - Invesco Solar ETF (TAN) April 14, 2008 - June 14, 2021, Weekly Candles Source stockcharts.com
Let’s also take note that TAN has traded at these levels before. It traded north of $220 back in the Summer of 2008. Hint, hint: there was $4 per gallon retail gasoline in the US at that time. I think it is wise to know the long-term trading history of instruments that are covered.
What could TAN do if additional solar subsidies are issued by the Biden administration and residential + commercial installations increase? Time will tell.
Now, for our premium subscribers, let's look to pinpoint potential entry levels in TAN, and recap the eight other markets that we are covering. Not a Premium subscriber yet? Go Premium and receive my Stock Trading Alerts that include the full analysis and key price levels.
Thank you for reading today’s free analysis. If you would like to receive daily premium follow-ups, I encourage you to sign up for my Stock Trading Alerts to also benefit from the trading action described - the moment it happens. The full analysis includes more details about current positions and levels to watch before deciding to open any new ones or where to close existing ones.
Thank you.
Rafael Zorabedian
Stock Trading Strategist -
Inflation and SPX Record Highs. PPI, FOMC Meeting in Focus
June 13, 2021, 11:32 PMEveryone (and I mean everyone) has been talking about inflation. We finally got the CPI print on Thursday: 0.6% vs. 0.4% expected! The S&P 500 didn’t seem to care, though. Record highs! What’s next?
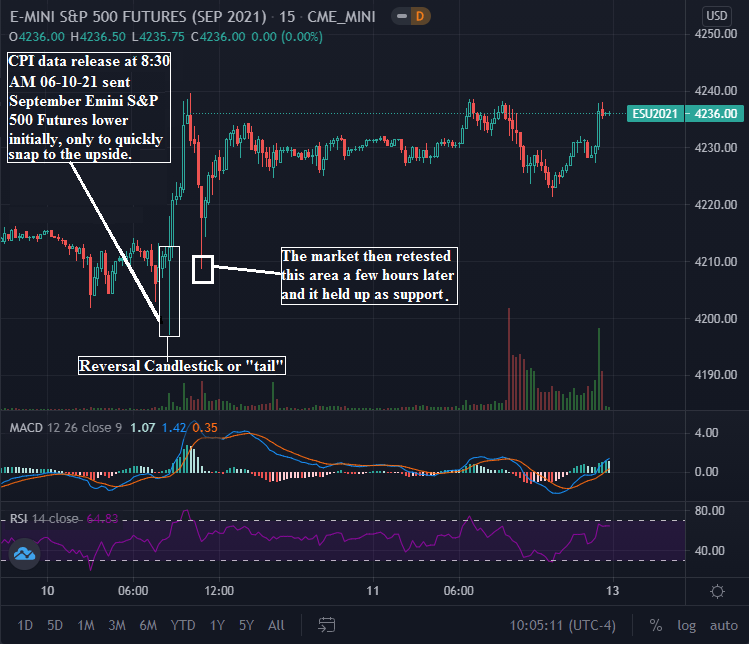
Inflation is real, folks. Two monthly prints in a row now, with the most recent June print showing the largest increases in used cars/trucks, transportation services, fuel oil, and apparel. Initially, the CPI data release was sold in futures trading at 8:30 AM on Thursday, but price action quickly reversed to the upside. This price action stuck out to me. Markets do not always react as expected when data releases come out. In a bull market like this, sometimes the data doesn’t matter. This price action tells us a story.

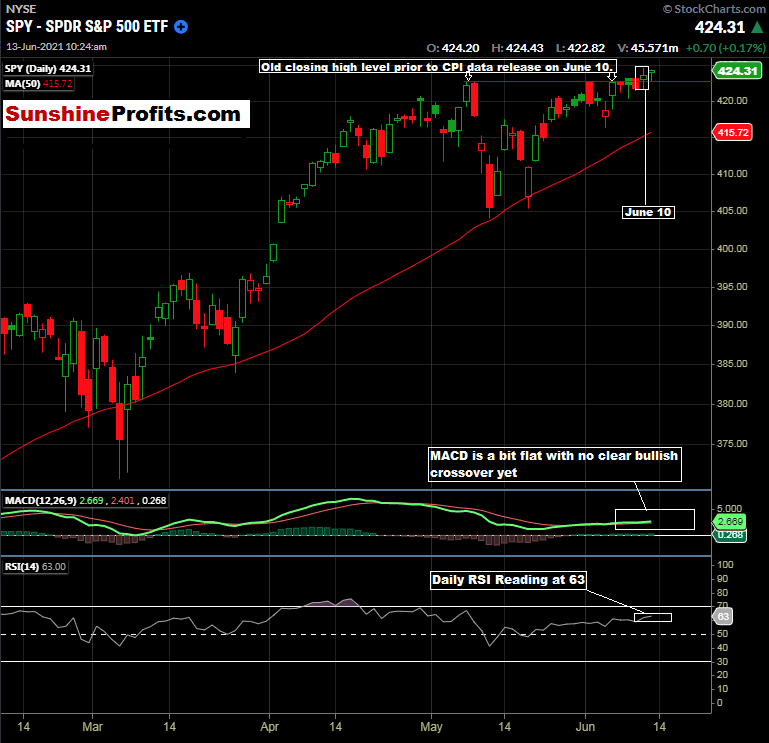
Figure 1 - SPDR S&P 500 ETF February 13, 2021, 8:45 PM - June 11, 2021, Daily Candles Source stockcharts.com
Notice the long “tail” or “wick” on the 8:30 AM candle above. The initial reaction was to sell the big CPI number, but it was quickly bought and ended up just being liquidity for the long/buy-side to gobble up and take the market higher. The retest that occurred hours later held up, and a new range was established for the remainder of the week.
The S&P 500 closed at an all-time closing high level on Friday.
What can this tell us? This market wants to move higher. Perhaps the higher inflation trickles into stocks as well; if used trucks cost more, couldn’t shares of stocks cost more too? It is plausible and also somewhat concerning. Higher inflation should not be construed as a bullish event, but as we know, markets can remain irrational - and for extended periods.
Drilling down to the intraday candles, we can see the price action that occurred when the CPI data was released. The September S&P 500 Futures quickly moved lower on the release, but within minutes, snapped back and reversed to the upside. The price area was retested hours later (see below), and this area held up very well as support.

Figure 2 - September Emini S&P 500 Futures June 9, 2021, 8:45 PM - June 11, 2021, 15-minute Candles Source tradingview.com
So, we have a bit of a conundrum on our hands in the US equity indices, in my opinion. We have the S&P 500 closing at all-time highs on Friday. The breakout (if you want to call it that) is a bit anemic as of now, and the other major indices have yet to close at all-time highs.
The Week Ahead
The major event this week: the FOMC meeting on June 15-16, with the Fed statement coming out on Wednesday at 2:00 PM ET. Prior to the Fed statement, we do have PPI and Retail Sales data coming out on Tuesday at 8:30 AM ET. The retail sales data will give us some additional insight into the US consumer, and the PPI is known to be a leading indicator of consumer inflation.
While Retail Sales and PPI could provide a spat of movement in the indices, I am expecting a quiet week leading up to the Fed decision on Wednesday afternoon. This type of quiet trade has been the prevailing theme lately; last week was quiet leading up to CPI, and the week prior was quiet leading up to Non-Farm Payrolls. Both of those numbers were anything but bullish by the way, but here we are at all-time highs in the S&P 500.
What is Working
While a pullback in the S&P 500 to the 50-day moving average would catch my attention for a potential long entry, there seem to be better places to focus on at this moment. The US infrastructure plays have been playing out well, even with the back and forth negotiations by the two parties.
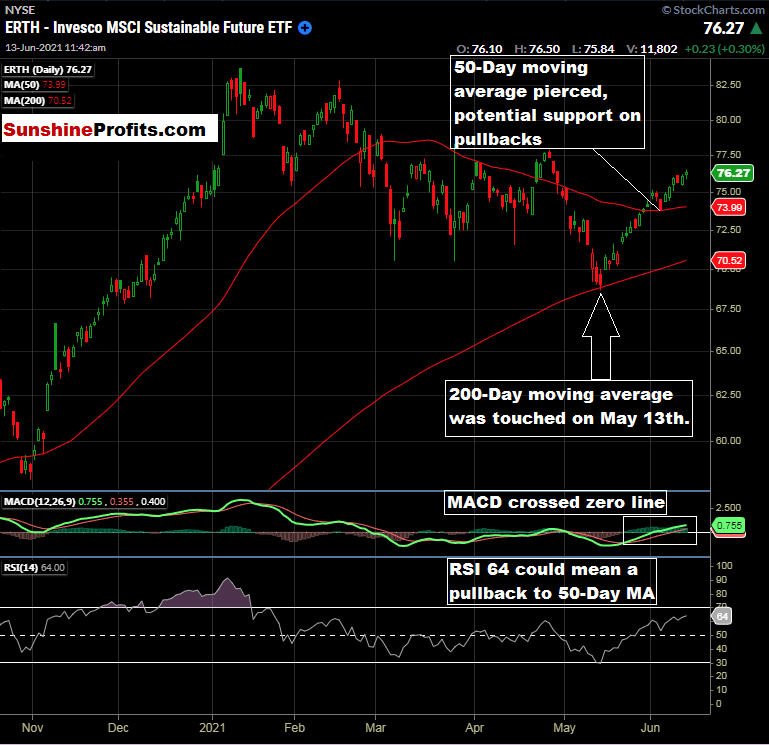
ERTH Invesco MSCI Sustainable Future ETF has been working well since we identified it for a long entry near its 200-day moving average in our May 10th publication, and it is still in the middle of its 2021 range.

Figure 3 - Invesco MSCI Sustainable Future ETF (ERTH) Daily Candles October 21, 2020 - June 11, 2021. Source stockcharts.com
I think that this name has legs over the long run given the current US administration and the fact that ERTH seeks to track the investment results of MSCI Global Environment Select Index. You can read more about ERTH here. If we get a pullback, I will be monitoring the 50-day Moving average level. I do think there is still time to get on board this one, and the holding period could be extended. Remember to monitor the 50-day moving average level, as it changes each day!
Now, for our premium subscribers, let's review the eight markets that we are covering, and see if anything changed upon the close of last week. Not a Premium subscriber yet? Go Premium and receive my Stock Trading Alerts that include the full analysis and key price levels.
Thank you for reading today’s free analysis. If you would like to receive daily premium follow-ups, I encourage you to sign up for my Stock Trading Alerts to also benefit from the trading action described - the moment it happens. The full analysis includes more details about current positions and levels to watch before deciding to open any new ones or where to close existing ones.
Thank you.
Rafael Zorabedian
Stock Trading Strategist -
Volatility? All Eyes on CPI – Looking Beyond the Data Release
June 10, 2021, 6:45 AMMarket participants are all waiting with bated breath ahead of today’s CPI data release. It’s an important one after last month's shocker. So, what’s your plan?
In general, data releases can be fickle and tricky events. While they may provide opportunities for algorithmic traders due to short-term spats of volatility, it can be challenging to initiate or exit a position as the market digests the data upon release. Longevity in trading can be achieved by being flat around data releases (or at least not highly leveraged); and/or having a what-if plan already in place.
Today’s CPI data (this publication is being written before the data release) could provide some fireworks. Last month, the expectations were for a 0.2% print, and we got 0.8%. Today, the market is looking for 0.4% for the CPI print (includes food and energy) and 0.5% for Core CPI (excludes food and energy). Could this be on the lofty side? Or, will inflation begin to spiral out of control?
Keep in mind that we are heading into a Fed Meeting June 15 -16. If prices continue to rise at an exponential rate, will the Fed really be willing to raise interest rates? It would be appropriate by many standards to do so. However, the theme has been “lower for longer”; and this creates a sense of uncertainty as to what the plan may be if we get another huge CPI print. While neither you nor I have a crystal ball available, my inclination is that the print could be below expectations. If that happens, it would fit the Fed’s “transitory inflation” theme that was discussed in the past. We will find out at 8:30 AM ET today.
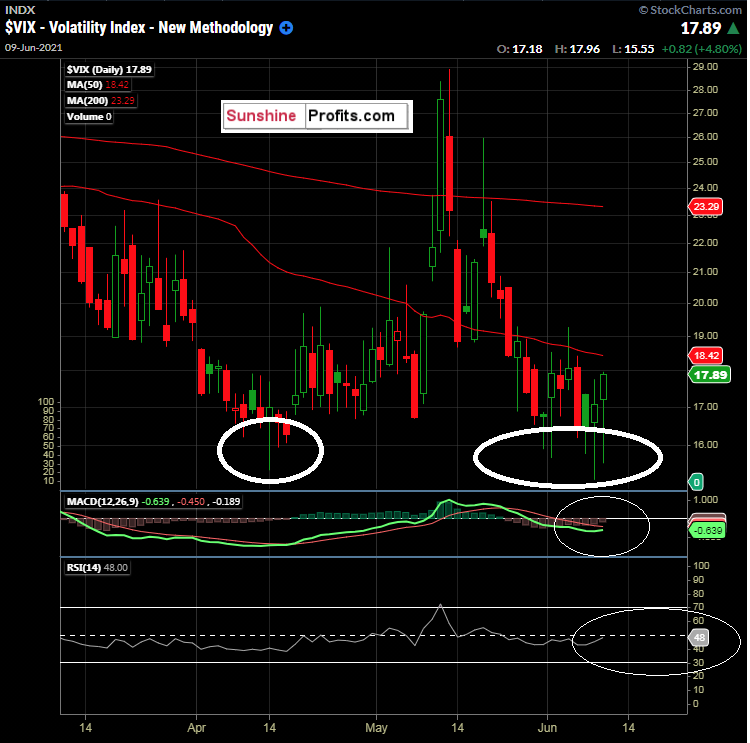
As traders wait on this data, the $VIX certainly caught a bump in yesterday’s trading.

Figure 1 - $VIX Volatility Index March 10, 2021 - June 8, 2021, Daily Candles Source stockcharts.com
We can see some technically bullish signs in the $VIX above, with some long daily tails on the candles coinciding with the April lows. RSI(14) and MACD(12,26,9) are showing bullish crossover signs. The $VIX can be a bit of a tricky barometer to trade technically.

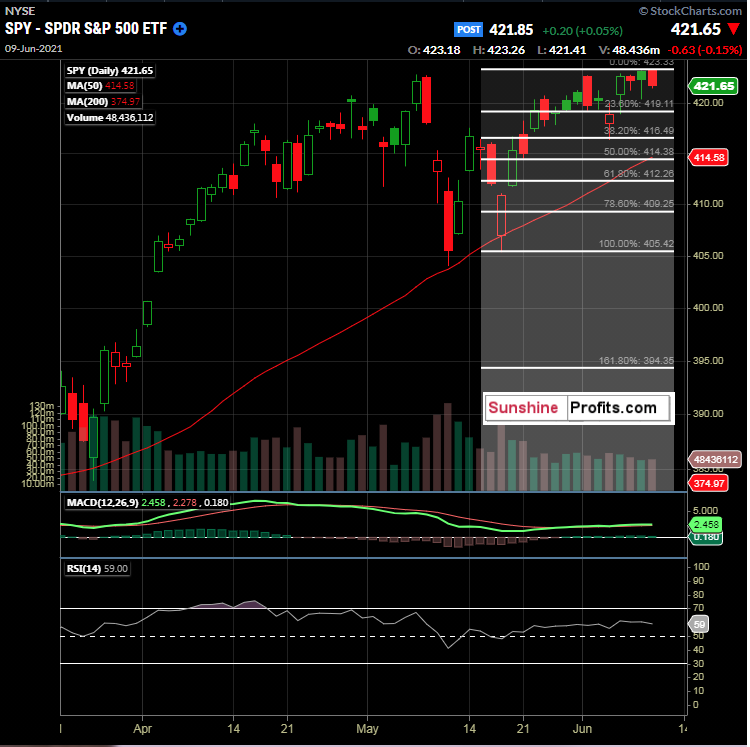
Figure 2 - SPY SPDR S&P 500 ETF March 9, 2021 - June 8, 2021, Daily Candles Source stockcharts.com
The SPY indeed put in a down session yesterday with the $VIX higher. As we have been discussing, the S&P 500 is near the higher end of its range and will most likely need a catalyst to get moving one way or the other.
The 50-day moving average is $414.58 right now, which is only 1.676% away from the current price. A move down to the 50-day moving average could be of interest.
In addition, we can see the Fibonacci retracement levels of interest in the SPY from the May 19th low to the June 8th highs. We see the 50% retracement level @ $414.38 and the 61.8% retracement level at $412.26. I like how the 50% retracement level lines up with the 50-day moving average here.

Figure 3 - SPY SPDR S&P 500 ETF March 9, 2021 - June 8, 2021, Daily Candles Source stockcharts.com
Next, no one knows with any degree of certainty how the equity markets will react to the CPI print, whether it exceeds or misses expectations. Here is what we do know: the last data release brought the cash S&P 500 near the 50-day moving average, which held up well. It then tested the 50-day moving average four trading sessions later, and it once again held up very well. Could the same type of price action be in store this time?
Nobody knows. However, I am inclined to look for a move for a potential pullback opportunity, between $412.26 (61.8% Fibonacci retracement level above) and the 50-day moving average ($414.58 as of the close on June 8th). If the market moves higher off the CPI data, so be it. The market will be there tomorrow. Remember to monitor the 50-day moving average level, as it changes each day!
Now, for our premium subscribers, let's recap the eight markets that we are currently covering. Not a Premium subscriber yet? Go Premium and receive my Stock Trading Alerts that include the full analysis and key price levels.
Thank you for reading today’s free analysis. If you would like to receive daily premium follow-ups, I encourage you to sign up for my Stock Trading Alerts to also benefit from the trading action described - the moment it happens. The full analysis includes more details about current positions and levels to watch before deciding to open any new ones or where to close existing ones.
Thank you.
Rafael Zorabedian
Stock Trading Strategist -
Timber! What Do Insane 2021 Lumber Prices Mean for You?
June 9, 2021, 9:21 AMAs many commodities have continued to climb impressively, one stands out like a sore thumb to me: lumber. What can the price of lumber mean, or more importantly, do for you?
Before diving into the lumber market, let’s review the current state of the S&P 500.
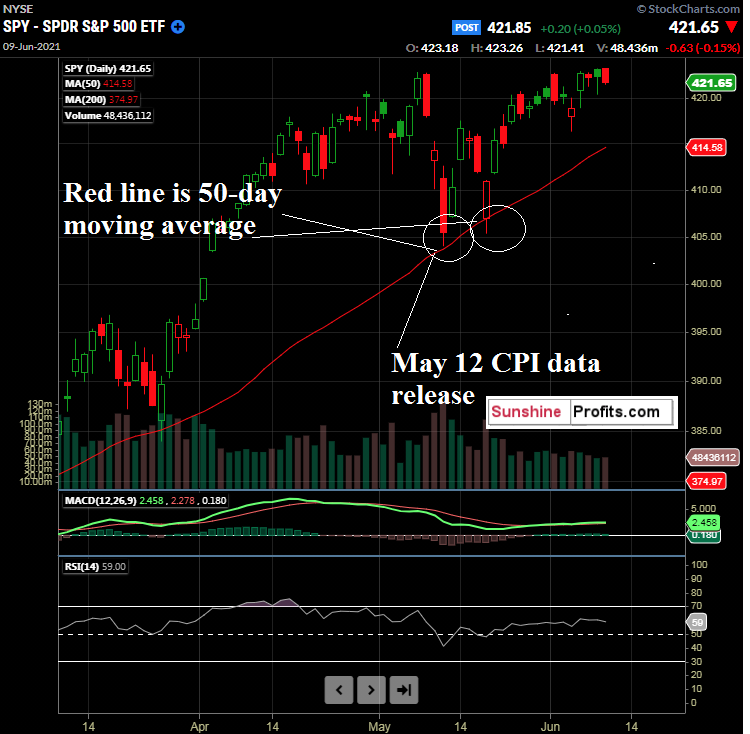
There weren’t too many surprises in the S&P 500 in Tuesday's cash session, as the $SPX settled practically flat on the day. $SPX is at the higher end of its recent range, as discussed in yesterday’s publication. It will most likely require a catalyst of some sort to push through higher or break lower from here. Will Thursday’s CPI data be the catalyst? I think it could be.
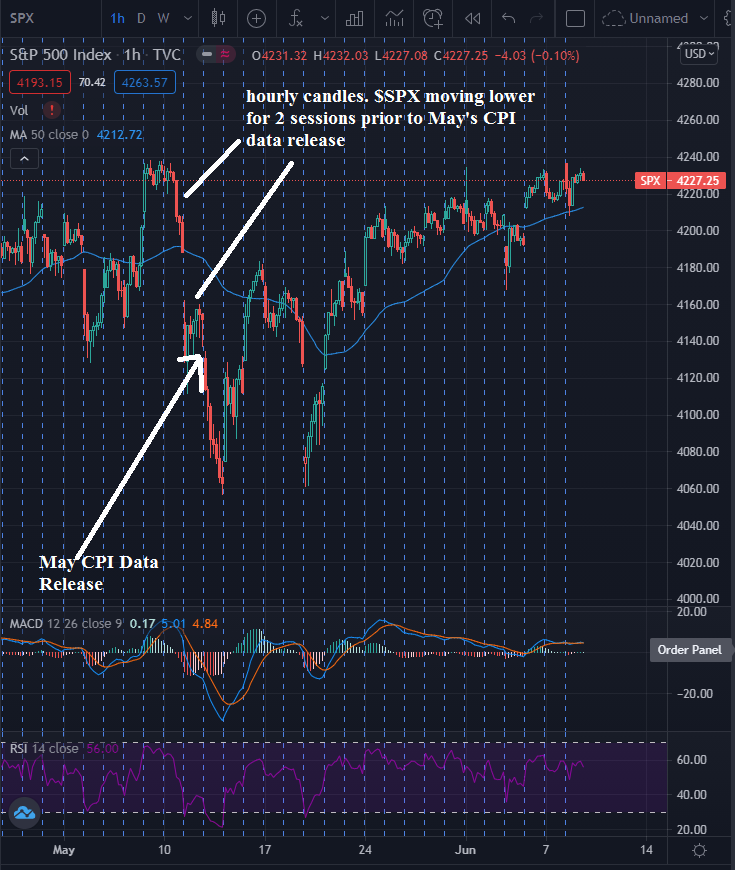
After last month’s monster CPI print, traders are on their tippy-toes waiting for this data release. It is important to know that the $SPX was already down for two consecutive sessions when last month’s CPI print came out. It then sold off further intraday (May 12) and closed sharply lower.

Figure 1 - $SPX S&P 500 Index April 28, 2021 - June 8, 2021, Hourly Candles Source tradingview.com
It seems like everyone is talking about inflation, and with good reason! It is real and is impacting lives. All eyes are peeled for Thursday's CPI data release.
Speaking of inflation, have you noticed the price of lumber lately? We all know that commodities are much higher and that homes are priced ridiculously high across most of the US. What amazes me is the demand and ability for borrowing at such high prices...but that is a subject for another time.
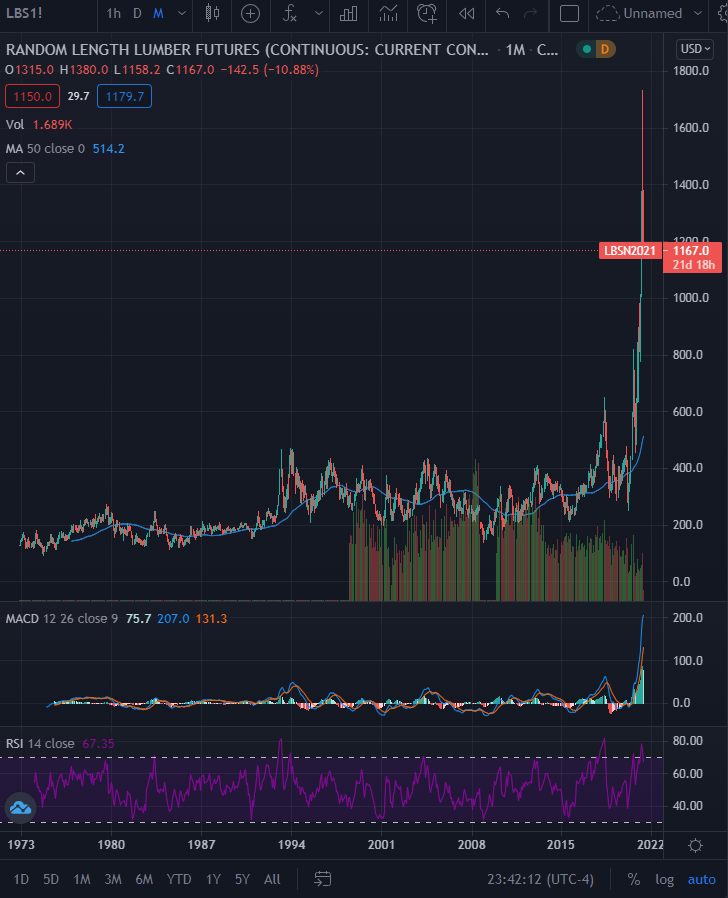
Check out this long-term chart of Lumber Futures (front-month):

Figure 2 - LBS1! Random Length Lumber Futures Continuous Contract December 1972 - June 2021 Monthly Candles Source tradingview.com
That’s a 48-Year chart for lumber, folks. Again, that is a chart for lumber. There is no Bitcoin or Dogecoin inside the lumber. There isn't any 24K gold hiding in there. It is wood, and it managed to go ~ 8X from the pandemic lows.
This monster clearly decided that the average prices over nearly half a century just didn’t apply anymore. What a move!
I want to put this in big bold letters here: I strongly suggest against trading in Lumber Futures. They can be illiquid, and experience many limit up and limit down days. You could be stuck in a losing position and not be able to get out. The only traders in Lumber futures should be hedgers that are in the wood business or deep pocket institutional traders that have real money to burn. Futures trading entails unlimited risk. I am sure that many fortunes have been made, and many more have been lost during this insane lumber market. Being on the wrong side of a futures market like that can be brutal.
Now that we have that out of the way, is there another way to participate in this market?
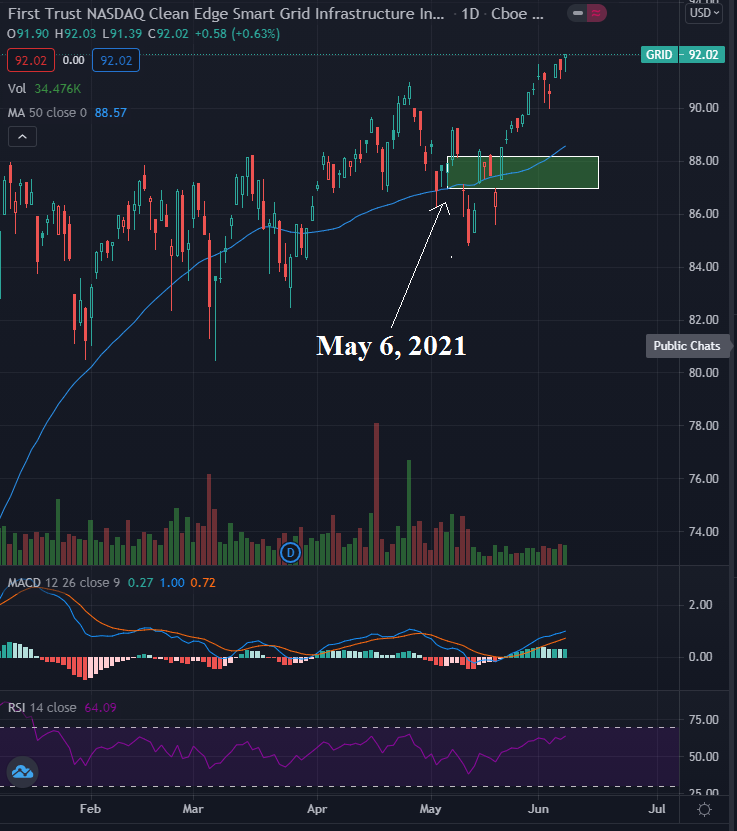
Yes, there is. But first, have you been following along with the GRID ETF trade that was covered in the May 6, 2021 publication? We were targeting an idea buy range of $86.91 - $88.17.

Figure 3 - First Trust NASDAQ Clean Edge Smart Grid Infrastructure Index Fund (GRID) Daily Candles January 7, 2021 - June 8, 2021. Source tradingview.com
Given the infrastructure bill theme that is currently in play in the US, the $100 Billion aimed at upgrading and building out the nation's electrical grid, and the fact that the new administration is still in its very early days, I don’t think it is too late to get aboard. I like pullbacks, and we will be covering them.
Now, for our premium subscribers, let's explore a potential opportunity in the lumber sector. Not a Premium subscriber yet? Go Premium and receive my Stock Trading Alerts that include the full analysis and key price levels. For a limited time, there is a 14-day trial available for only $9!
Thank you for reading today’s free analysis. If you would like to receive daily premium follow-ups, I encourage you to sign up for my Stock Trading Alerts to also benefit from the trading action described - the moment it happens. The full analysis includes more details about current positions and levels to watch before deciding to open any new ones or where to close existing ones.
Thank you.
Rafael Zorabedian
Stock Trading Strategist -
Patience! Small Cap Value Could Be Opportune on Pullbacks
June 8, 2021, 9:54 AMIf you have been following along, you know about the Russell 2000 Reconstitution. Is there a way to make it work for you with a value theme?
Before we dig into opportunities on pullbacks, here’s a brief reminder about yesterday’s recap of the various ETFs we’re following and the good calls we’ve had on them.
Buying on PullbacksAs this US equity bull market marches on, it is a good practice to keep a pulse on the broader indices in the short-term, to take a current measure of a market. While reviewing many different ETFs, it is apparent that many of the charts look the same at this moment.
If buying, I prefer to buy on pullbacks. Who doesn’t? Many traders like to trade on momentum, and that is also a proper strategy. For me, it is the pullbacks in a bull market that seem to have the most favorable risk/reward propositions, so taking a measure of the broader indices regularly can be beneficial.

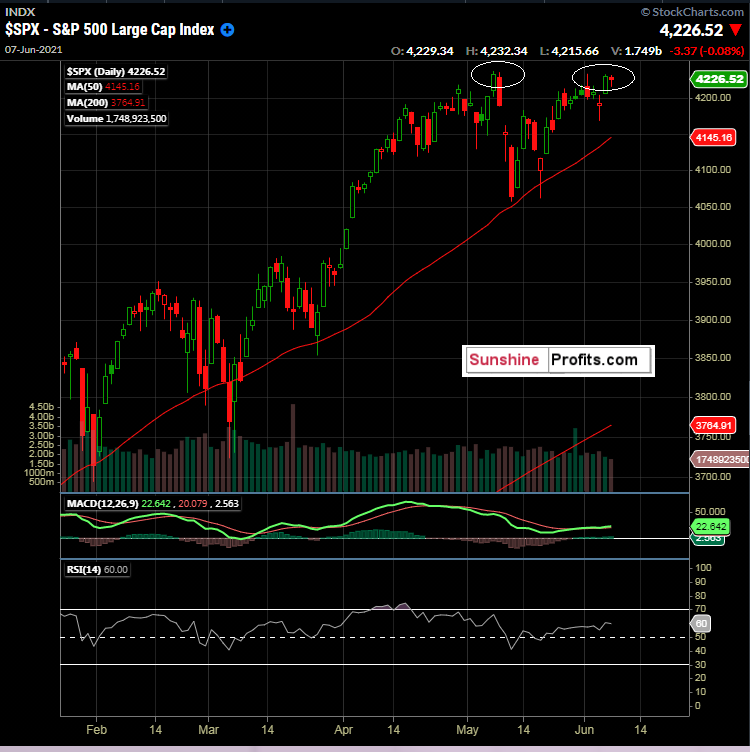
Figure 1 - $SPX S&P 500 Index January 22, 2021 - June 7, 2021 Daily Candles Source stockcharts.com
As we can see, the $SPX is near the top end of its short-term range, with the key levels to know being 4232.60 being its all-time closing high (so far) on May 7. 2021.
Given the current macroeconomic theme, including higher inflation, a weaker dollar overall, government spending, corporate labor expense reductions (think working at home), and more, I do expect the overall market to continue its march higher. However, when we are in a range, I don’t find much benefit to getting long near the very top end of a range for several reasons.
- What if the top of the range holds? Then, I could have used more patience , and gotten a better entry level.
- What if the market breaks out of the top of the range and then fails? Patience would have been good here too.
- What if the market breaks out of the top of the range and continues marching higher?! Then we may have missed a short-term opportunity. However, markets like to come back and test the old highs of ranges. This allows more time to discover more information and to potentially get even better entry points. Patience can go a long way.
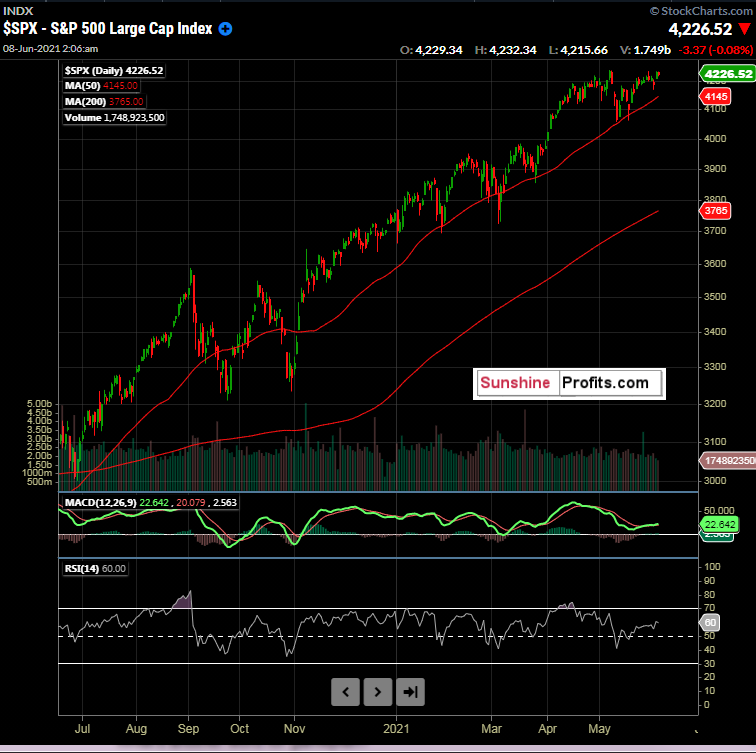
So, at this moment, I would be looking at the 50-day moving average. Keep that on your radar, folks! It has been an excellent indicator in the S&P 500 on many attempts. You can read more about this in the May 12th publication.

Figure 2 - $SPX S&P 500 Index June 18, 2020 - June 7, 2021 Daily Candles Source stockcharts.com
Given that we are at the top of the recent range, I like to analyze some what-if scenarios. What if we do get a pullback? That would be the best scenario, in my opinion. If and when a pullback occurs, there may be several trades already in place. That can be working well for a trader to ride out a garden variety pullback while making a shopping list for new opportunities. So, what if we get a pullback, to say the 50-day moving average?
The small-cap value space has been a solid place to be in 2021. The ETFs in this space focus on smaller market capitalization stocks that seek value instead of growth. While "small cap value" may sound counterintuitive, there have been some ETFs with exceptional performance in this area during 2021.
With patience being the key theme today, where could we focus attention, if and when we get a meaningful pullback? Today, for our premium subscribers, we dig into an ETF in the space that has delivered a YTD return exceeding 45% as of the time of this writing.
Not a Premium subscriber yet? Go Premium and receive my Stock Trading Alerts that include the full analysis and key price levels.
Thank you for reading today’s free analysis. If you would like to receive daily premium follow-ups, I encourage you to sign up for my Stock Trading Alerts to also benefit from the trading action described - the moment it happens. The full analysis includes more details about current positions and levels to watch before deciding to open any new ones or where to close existing ones.
Thank you.
Rafael Zorabedian
Stock Trading Strategist

Free Gold &
Stock Market Newsletter
with details not available
to 99% investors
+ 7 days of Gold Alerts
Gold Alerts
More-
Status
New 2024 Lows in Miners, New Highs in The USD Index
January 17, 2024, 12:19 PM -
Status
Soaring USD is SO Unsurprising – And SO Full of Implications
January 16, 2024, 8:40 AM -
Status
Rare Opportunity in Rare Earth Minerals?
January 15, 2024, 2:06 PM

