

-
Knowing Your Strengths and Weaknesses as A Trader
June 24, 2021, 10:39 AMAvailable to premium subscribers only.
-
S&P 500 Near All Time Highs and What We Got Right.
June 23, 2021, 11:32 AMIt was a thunderous day for equity indices yesterday, with the S&P 500 approaching all-time highs. Our analysis has worked well. What comes next for the benchmark US index?
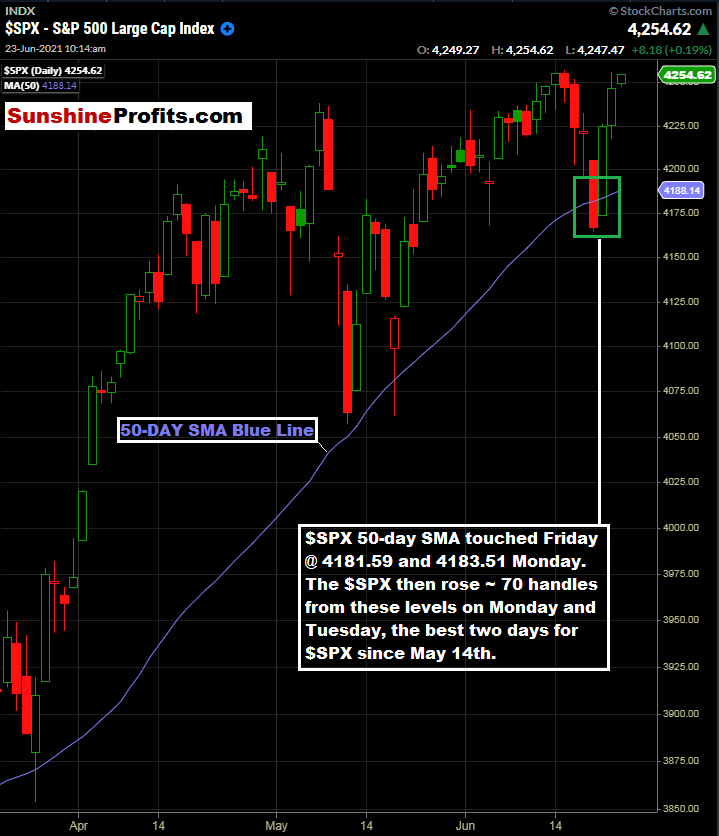
Greetings! What a move in the $SPX from its 50-day moving average touched on Friday and Monday. In fact, the S&P 500 had its best two days since May 14th!
We heard from Chair Powell yesterday during his testimony at the House of Representatives. It was a politically fueled discussion, with Republicans highlighting the lack of desire of many workers to return to work in some states. The market moved higher off the testimony, with Chair Powell reiterating that inflation was indeed transitory and very sector-specific. Is this correct? I suppose time will tell. What matters for us is that the broader markets moved higher during and after the testimony; while beginning to retreat in the final 30 minutes of the NY session.
If you have been following along or are a Premium subscriber, you know that we had been waiting for an entry into the S&P 500 at or near the 50-day simple moving average for quite some time. After waiting with patience and discipline, we got our signal on Friday and Monday with the $SPX briefly trading below this key level and ultimately reversing to the upside on Monday.

Figure 1 - S&P 500 Index March 19, 2021 - June 23, 2021, Daily Candles Source stockcharts.com
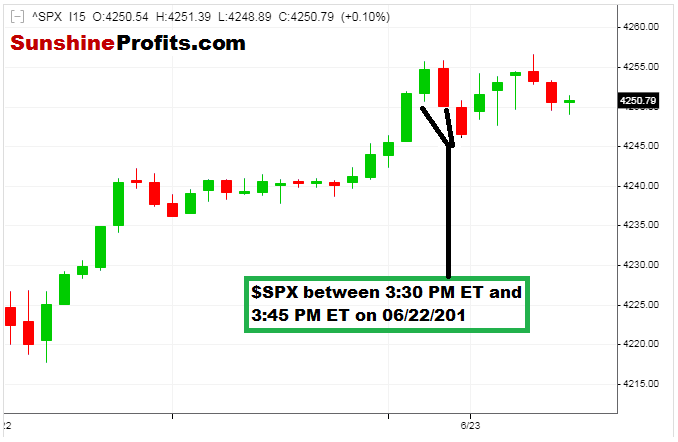
What a wonderful move for us. It takes patience and discipline to wait and execute. Now, if you are a Premium subscriber, you received an email alert at approximately 3:38 ET yesterday, suggesting to consider exiting long S&P 500 positions. There were several reasons for this:
- I realized this was the best two-day period in five weeks .
- Hourly RSI(14) was approaching the 70 level - indicating short-term overbought conditions.
- Being greedy is never a good thing.
- S&P 500 was within 10 handles of all-time highs.
So, around 3:30 PM ET yesterday, all of this came together in my mind and indicated that it may be a good time to sell. What if it keeps going up? Who cares. Nobody catches exact tops and bottoms in trading. The idea is to catch the meat of the move before the market takes it away. And with everything going on including inflation, higher rate environment digestion, and numerous other factors, it was a good time to take chips off the table.

Figure 2 - S&P 500 Index June 22, 2021 - June 23, 2021, 10:58 AM, 15 Minute Candles Source stooq.com
I have been in and around the S&P 500 long enough to know when the index throws you a bone; you take it.
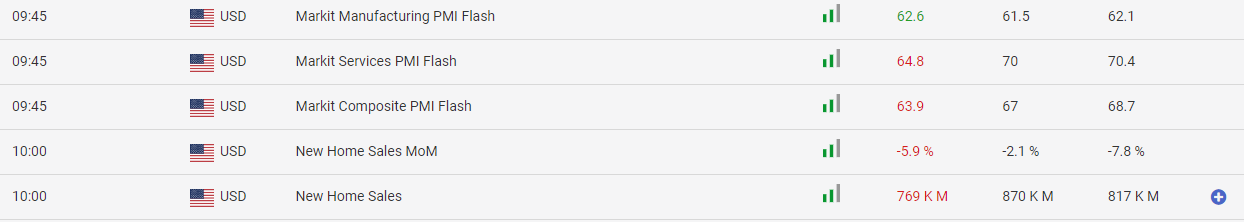
In addition, trading the $SPX around and near all-time highs can be tricky business. What would be the catalyst to break out above the old high? This morning, we got a mixed bag of mostly bearish economic data including New Home Sales, and PMI metrics. Courtesy of our friends at FX Empire:

Figure 3 - Certain US Economic Data Releases for June 23, 2021 Source fxempire.com
As we can see from the above table, this morning's economic data was nothing to write home about. However, markets can remain illogical for extended periods. For the moment, my attention turns away from the indices and goes back to select names and themes until more time passes. You have to know when to stay away, too.
Now, for our premium subscribers, let’s recap the markets that we are covering to see if any key levels have changed or new opportunities have been found. Not a Premium subscriber yet? Go Premium and receive my Stock Trading Alerts that include the full analysis and key price levels.
Thank you for reading today’s free analysis. If you would like to receive daily premium follow-ups, I encourage you to sign up for my Stock Trading Alerts to also benefit from the trading action described - the moment it happens. The full analysis includes more details about current positions and levels to watch before deciding to open any new ones or where to close existing ones.
Thank you.
Rafael Zorabedian
Stock Trading Strategist -
S&P 500 Snapback, USD Strength. What’s Next for US Equities?
June 22, 2021, 7:49 AMMonday gave us a fast snapback rally in the major US indices, with the S&P 500 adding 1.40% and erasing Friday’s losses. What’s on tap for the remainder of this week?
Good morning folks. Today we hear from Fed Chair Jerome Powell again at 2:00 PM, as he provides testimony on the Fed’s lending programs and policies. I am sure the market will be hanging on every word. However, what else could be said at this moment to either spook or encourage market participants? On Friday, the Fed’s Bullard talked about Q4 2022 for an initial hike and said that Chair Powell has already opened up talks of tapering. This commentary spooked the markets on Friday and led to the decline. But, we have already regained those losses (on Monday at least).
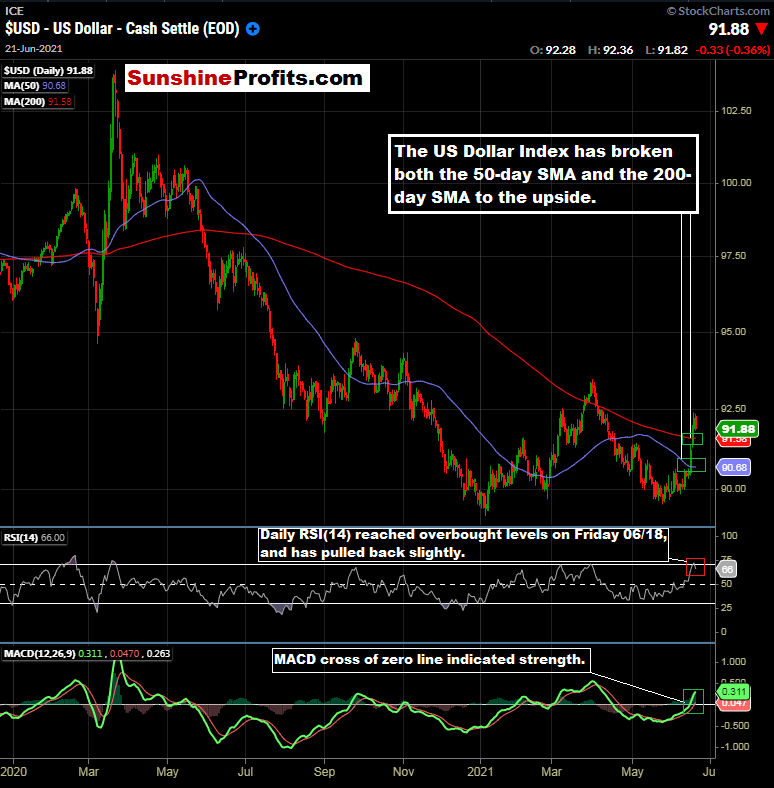
All of this hawkishness sure has moved the US Dollar to the upside. As I discussed in the May 19th publication, the $DXY had been approaching a key long-term Fibonacci retracement level before all of this hawkish talk even began. It never actually traded to it ($88.36); however, it got very close: around $89.60, and found support. Time will tell if the US dollar strength is sustainable. By looking at the technicals, it looks like it could be.

Figure 1 - US Dollar Index December 20, 2019 - June 21, 2021, Daily Candles Source stockcharts.com
We can see the breakout about the 50 and 200-day Simple Moving Averages. In addition, we have the MACD crossing the zero line to the upside. The next test of strength will be to see if the $DXY can hold its 200-day moving average on a test, which sits at 91.58 as of the close on June 21st.
Commodities, however, have broadly held their strength with the $DXY increasing. The big exception being interest-rate-sensitive precious metals. The general inflationary theme seems to be sticking right now.

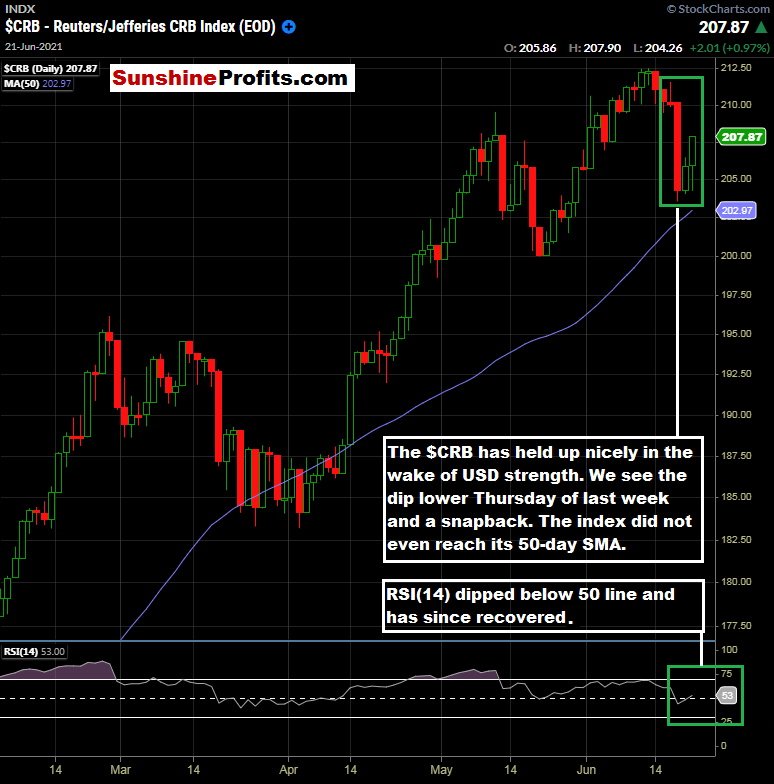
Figure 2 - $CRB Reuters/Jefferies CRB Index February 3, 2021 - June 21, 2021, Daily Candles Source stockcharts.com
Commodities are still firmly entrenched in an uptrend. It is an interesting phenomenon to see the US Dollar moving higher and commodities moving higher simultaneously. That could portend things to come in the future. Combined with higher rates, the overall market picture could change significantly over time in the long run. However, that’s a story for another time.
Instead of getting caught up in the longer-term picture for the markets, we want to stay focused and dialed in on the short and medium-term to capture potential opportunities. Based on the snapback that our subscribers were prepared for in the broader markets, we start to get a sense of how the market may react to the more hawkish Fed rhetoric in the short term.
Until things appear differently, buying the dips is still the higher probability move, in my opinion, especially in select names and themes.

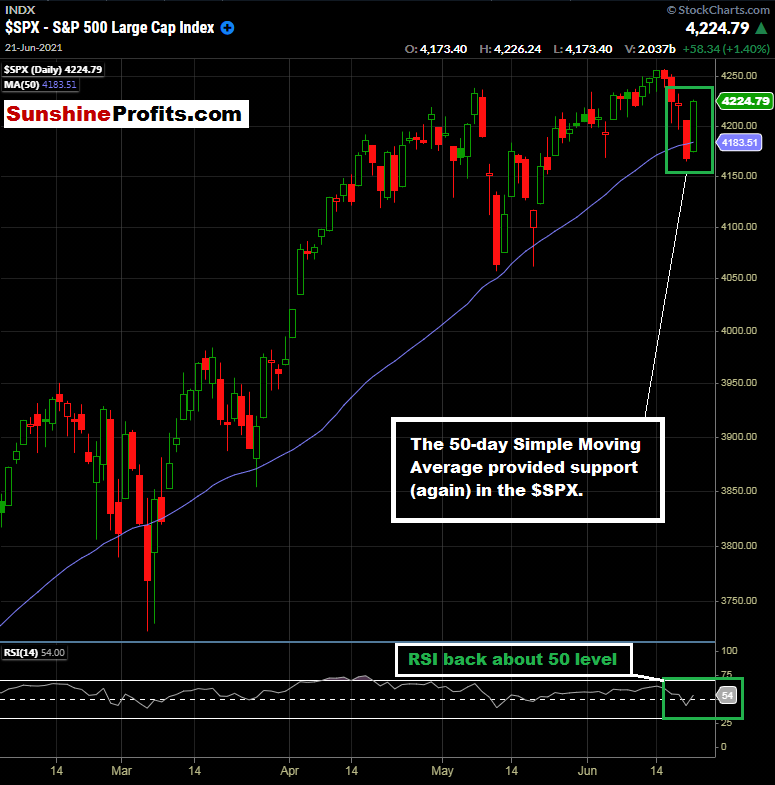
Figure 3 - S&P 500 Index February 3, 2021 - June 21, 2021, Daily Candles Source stockcharts.com
I want to emphasize the aforementioned select names and themes. A broader market rally like we saw yesterday is fantastic and was something that we were looking for based on a 50-day moving average pattern repetition. I think we can look to further stack the odds in our favor by drilling down to specific names, sectors, and stories.
Market Themes Change Over Time
Let’s not discount the fact that the Fed has changed its stance. Rates will most likely increase in the future. There should be some tapering coming soon, and tapering will not be instant; it is a process that occurs over many months or even over a year. These things will certainly impact overall market sentiment. Trading the S&P 500 via the ES, SPY, or $SPX (for equity options) is a solid strategy. However, I am beginning to realize the importance of individual names and themes in what could very soon be more of a stock pickers market versus a broader market story.
This is one reason I am currently covering nine markets for premium subscribers (S&P 500 and eight others). We just got great pullback action at the end of last week, and we were ready for it. Yesterday’s broader market action was just what we wanted to see.
Now, for our premium subscribers, let’s recap the nine markets that we are covering to see if anything has changed since yesterday. Not a Premium subscriber yet? Go Premium and receive my Stock Trading Alerts that include the full analysis and key price levels.
Thank you for reading today’s free analysis. If you would like to receive daily premium follow-ups, I encourage you to sign up for my Stock Trading Alerts to also benefit from the trading action described - the moment it happens. The full analysis includes more details about current positions and levels to watch before deciding to open any new ones or where to close existing ones.
Thank you.
Rafael Zorabedian
Stock Trading Strategist -
What a Welcome US Equity Market Pullback! Fading Emotion.
June 21, 2021, 7:14 AMAre you as glad to see the pullback in the US equity indices as I am? Yes, rates are going up faster. Inflation has been acknowledged at a higher rate by the Fed. So what?!
It was no secret that rates could not remain near-zero forever. It also is no secret that inflation has been real in the US. If you live in the US, you already know this from your day-to-day life. So, why the big fuss? Did you need someone to tell you?
I know it is painful when long positions move against a trader quickly. Nobody expected the Fed to come out with the language that appeared this week, at least not anybody that I know. I also realize that it may seem logical to sell equities as a result. But, since when does the obviously logical approach win?
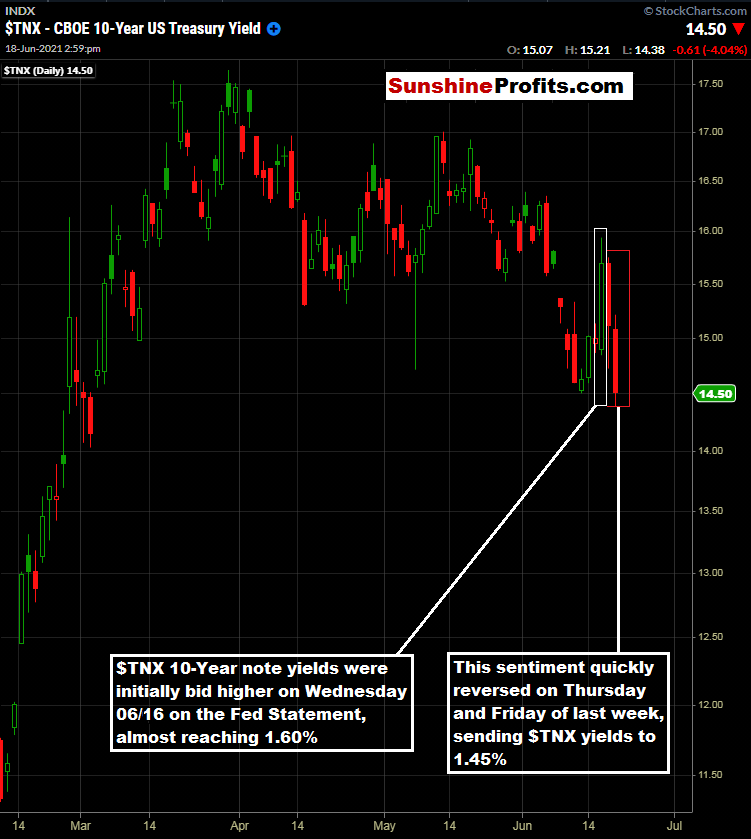
So, the overnight Fed Fund rate is scheduled to begin increasing in 2023 (potentially late 2022 if you listened to Bullard on Friday). This news must mean that the Ten-year note yield had to go up, right? Nope. Down she went on Thursday and Friday; after catching a bid on Wednesday off the news.

Figure 1 - $TNX Ten-year note treasury yield February 10, 2021 - June 18, 2021, Daily Source stockcharts.com
Perhaps taking a trade like that is just too obvious; too logical. Now, will $TNX increase over time? Most likely it will, but 2023 is a long time from now. We have to wait and see how the new information is digested by the market and go from there.
Can we look to apply similar logic to the S&P 500? For that question, I would like to refer back to the May 12th publication where we discussed $SPX pullbacks to the 50-day simple moving average.
From May 12th:
- $SPX found support around the 50-day moving average on 2 of its last 3 attempts.
- When $SPX broke the 50-day on 1 of the last 3 attempts, it traded below it for 2 sessions.
- When $SPX broke the 50-day in September 2020 & October 2020, it closed below it between 7 - 9 sessions.
Let’s keep in mind that the $SPX traded to the 50-day SMA on May 12th and May 19th, and is now below the 50-day SMA as I write this.
Today, for the SPY ETF traders out there, let’s take a fresh look at recent pullbacks.

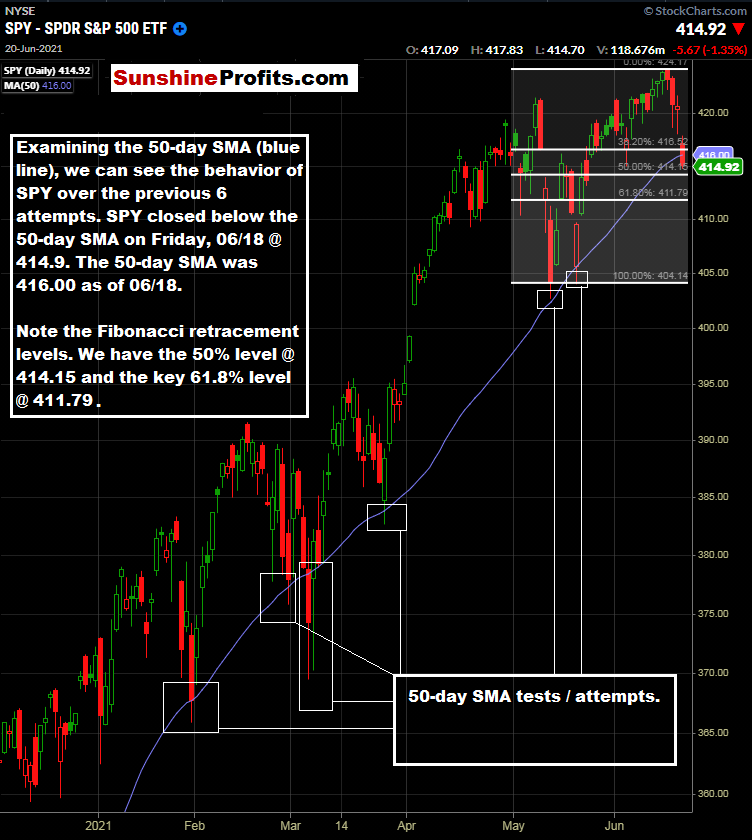
Figure 2 - SPDR S&P 500 ETF December 04, 2020 - June 18, 2021, Daily Candles Source stockcharts.com
Can the previous price action near the 50-day SMA give us any clues about what could happen this time? Well, we have the 50-day SMA, and we also have the 414.15 50% Fibonacci retracement level and the 411.79 key 61.8% retracement level. We have been waiting for such a pullback and I don’t think the recent Fedspeak is any reason to negate consideration of buying pullbacks. I know it seems somewhat illogical; that’s why I like it even more.
Keep in mind that such pullbacks to certain price levels could take place in the overnight futures sessions. In that case, ETF traders may not get the exact price they are looking for if markets reverse to the upside during NY trading hours. At least this gives us some levels to consider.
Why I Welcome this Pullback So Much
If you have been following along and are a premium subscriber, you know that I have been waiting for pullback opportunities across many markets. In fact, out of the eight markets that I am covering, I have been waiting for pullback opportunities in six of them. The current price action and additional downside momentum could give us the opportunities that we have been patiently waiting for in several ETFs.
Now, for our premium subscribers, we have a lot to cover. As we approach potentially key levels that we have been waiting for with patience and discipline, a plan is required. There are buy idea levels that could be triggered soon and were very close to triggering on Friday. Not a Premium subscriber yet? Go Premium and receive my Stock Trading Alerts that include the full analysis and key price levels.
Thank you for reading today’s free analysis. If you would like to receive daily premium follow-ups, I encourage you to sign up for my Stock Trading Alerts to also benefit from the trading action described - the moment it happens. The full analysis includes more details about current positions and levels to watch before deciding to open any new ones or where to close existing ones.
Thank you.
Rafael Zorabedian
Stock Trading Strategist
Free Gold &
Stock Market Newsletter
with details not available
to 99% investors
+ 7 days of Gold Alerts
Gold Alerts
More-
Status
New 2024 Lows in Miners, New Highs in The USD Index
January 17, 2024, 12:19 PM -
Status
Soaring USD is SO Unsurprising – And SO Full of Implications
January 16, 2024, 8:40 AM -
Status
Rare Opportunity in Rare Earth Minerals?
January 15, 2024, 2:06 PM

