

-
Stock Trading Alert & Enjoy the Weekend!
July 2, 2021, 1:22 PMAvailable to premium subscribers only.
-
NFP Data on Tap, S&P 500 Slowly Grinds Higher, Overbought?
July 1, 2021, 12:09 PMHoliday-style trade, narrow ranges, and low volatility have been this week’s theme in the S&P 500 thus far. What is the slow chug leading up to, with Friday's BIG Jobs Number?
It seems like we just got the last jobs number yesterday, but here we are again awaiting the big data drop on Friday at 8:30 AM ET. The market consensus seems to be for 700K jobs added during the month of June, with some consensus indicators showing 690K. The expectations have seemed to increase over the last week, as expectations have risen from ~ 660K.
Last month, the Non-Farm Payroll number missed expectations; printing at 559K versus 645K expected, and the US Equity and bond markets did not care, as both marched higher.
But that was so last month. How could the markets behave on Friday’s data release?
I tend to avoid having leveraged open positions heading into big data releases like NFP and CPI. Longer-term swing trades and position trades are just fine to hold onto, however.
There is some seasonality for the S&P 500 to move higher heading into the 4th of July. Some analysis shows getting long 2 days prior to the release yields certain results over X amount over a number of years, and other analysis seems to show getting long the day before is good too. You can read about what veteran Trader Larry Williams had to say about this last year.
Analyzing the SPY today for the ETF Traders out there:

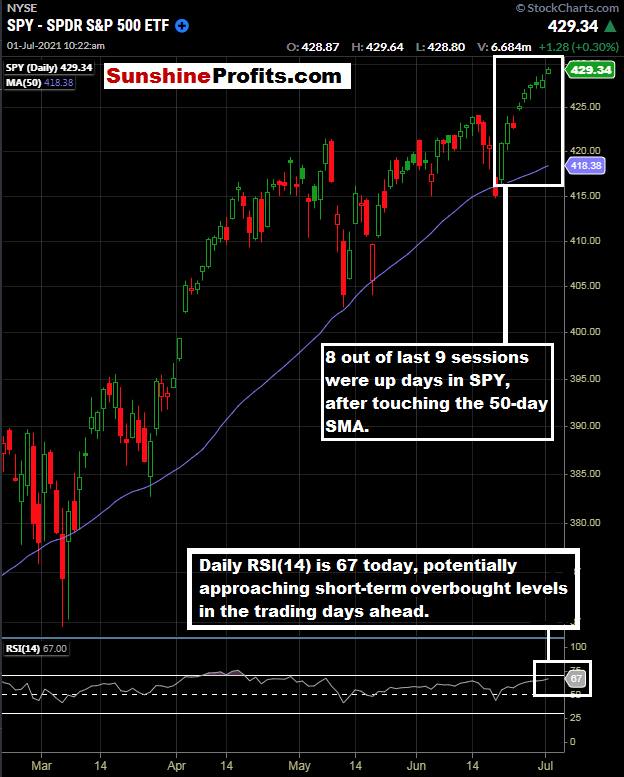
Figure 1 - SPDR S&P 500 ETF February 18, 2021 - July 1, 2021, 10:20 AM, Daily Candles Source stockcharts.com
Looking at the SPY, we have been higher eight out of the last nine trading sessions! That is a rare feat in the index. Given the recent selloff to the 50-day moving average that we were waiting for, it does make sense that we have continued higher, but eight out of the last nine sessions is rare. This is just some food for thought. In addition, we are seeing Daily RSI(14) at 67, which could indicate the SPY approaching short-term technically overbought levels in the trading days ahead. It is not all that often where the SPY will hold an RSI(14) Daily level above 70 for a lengthy period.
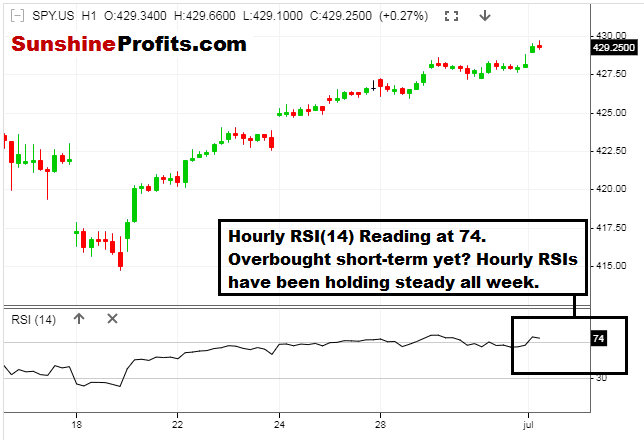
Drilling down further to the hourly candles, I notice some indications of short-term overbought levels (well, we have been higher in eight of the last nine trading sessions, after all!).

Figure 2 - SPDR S&P 500 ETF June 15, 2021 - July 1, 2021, 10:45 AM, Hourly Candles Source stooq.com
There aren’t too many surprises here when looking at the hourly chart. The S&P 500 has been moving higher steadily, and it feels like we are headed for a short-term volatility spat (either higher or lower) with the NFP data release on Friday.
Let’s keep in mind that this is a Holiday week in the US. Trading volumes tend to dry up, and slow moves higher can be a prevailing theme during holiday-style trading. US equity markets are closed on Monday, July 5th in observance of Independence Day in the US. Some futures products will trade on July 5th with abbreviated trading sessions. You can see the Holiday trading hours for the CME here. Be sure to know the holiday trading hours for your product!
Heading into Friday, I am not expecting much in the way of market fireworks before the NFP data release. The slow grind higher has been the theme as market participants await the big NFP jobs data.
Let’s recap the markets we are following and see if there are any key levels or developments in each for Premium Subscribers.
Not a Premium subscriber yet? Go Premium and receive my Stock Trading Alerts that include the full analysis and key price levels.
Thanks for reading today’s article. Have a great Independence Day Weekend!
Thank you for reading today’s free analysis. If you would like to receive daily premium follow-ups, I encourage you to sign up for my Stock Trading Alerts to also benefit from the trading action described - the moment it happens. The full analysis includes more details about current positions and levels to watch before deciding to open any new ones or where to close existing ones.
Thank you.
Rafael Zorabedian
Stock Trading Strategist -
Mid-Session Stock Trading Alert: ETF Entry Signal Triggered
June 30, 2021, 11:39 AMAvailable to premium subscribers only.
-
Getting a TAN and Sticking with Working Strategies
June 29, 2021, 11:38 AMAnother day, another all-time high seems to have been the prevailing theme lately. Sticking with working strategies and themes may seem challenging, but fighting the tape is not the answer.
It can feel counterintuitive for traders to go with the trend sometimes. I know! A trader may see a chart going from the bottom left of the chart to the upper right-hand corner and wants to take the other side of the trade badly, even though it is counter-trend. Logic might dictate that whatever market you are following should be selling off, and it continues roaring higher like a roaring bull. While I am not trying to be oversimplified here, I want to reiterate that the trend is indeed your friend.
Even when many technical indicators might indicate that a market is overbought (or oversold), a market will oftentimes continue moving in the same direction, leaving many counter-trend traders in its wake. This is the reason that buying pullbacks in a bull market has been the focus here, opposed to trying to pick tops. It is never easy picking tops and bottoms in any market.
This is the major reason that I like to revisit what has been working.
Looking back at the US equity markets over the last couple of weeks, the theme seemed to be bipolar at face value; but has it really? If we take out the fundamental development of the Fed changing stance on interest rates, has the price action been anything more than typical?

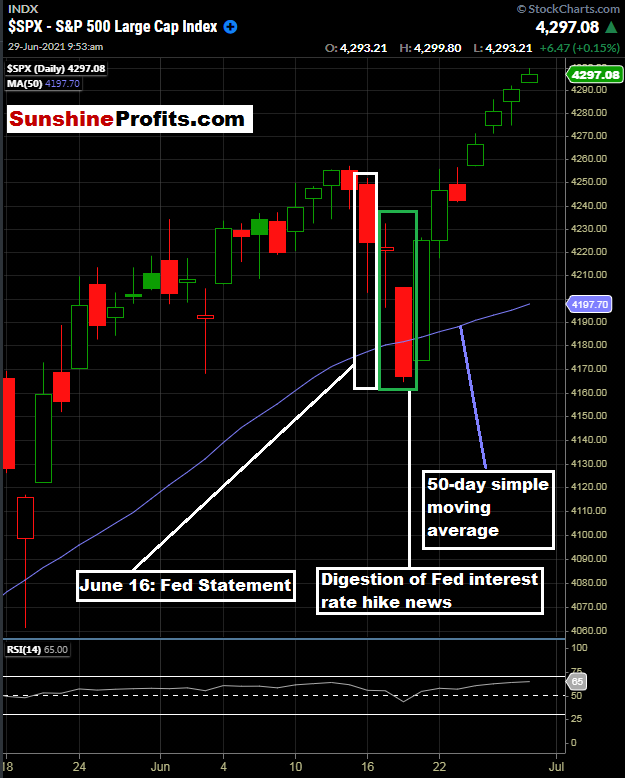
Figure 1 - S&P 500 Index May 18, 2021 - June 29, 2021, 10:00 AM, Daily Candles Source stockcharts.com
I know it felt like the sky was falling when the Fed changed its stance on future interest rate guidance. In reality, the pullback was pedestrian on the day of the event, and the subsequent market digestion brought the S&P 500 to the 50-day SMA (slightly below) for a short period. There is nothing so spectacular about that. It is just the sign of a healthy bull market.
Looking at the pullback that we saw two weeks ago, it was approximately 2.24%. It felt like it was a larger selloff than that, right? That is what happens when the markets are fired up with emotion, and everyone has their take on what is going to happen next.
In reality, if a trader had a plan to buy the pullback at a predefined level, the news of the projected interest rate hikes was just a vanilla buying opportunity. Our readers were prepared, as we have been analyzing what has been working recently: buying the $SPX at the 50-day moving average as detailed on several occasions - including the June 10th publication. It was on our shopping list, and waiting for the pullback was indeed the right move.
It takes discipline, patience, and execution.
As the S&P 500 has marched higher since touching the 50-day moving average, we currently have the daily RSI(14) sitting near 65-66 and the index trading near the psychologically round number of 4300. Many traders may use these metrics to take some chips off the table. However, is shorting the market there the right thing to do? Some traders may try, some may succeed, and some will lose. The important message of the day is to trade with the trend, and have a plan in place when conditions are right.
It is not to say that buying dips is the only way. For example, our Premium subscribers were alerted to TAN Invesco Solar ETF in our June 15th publication.

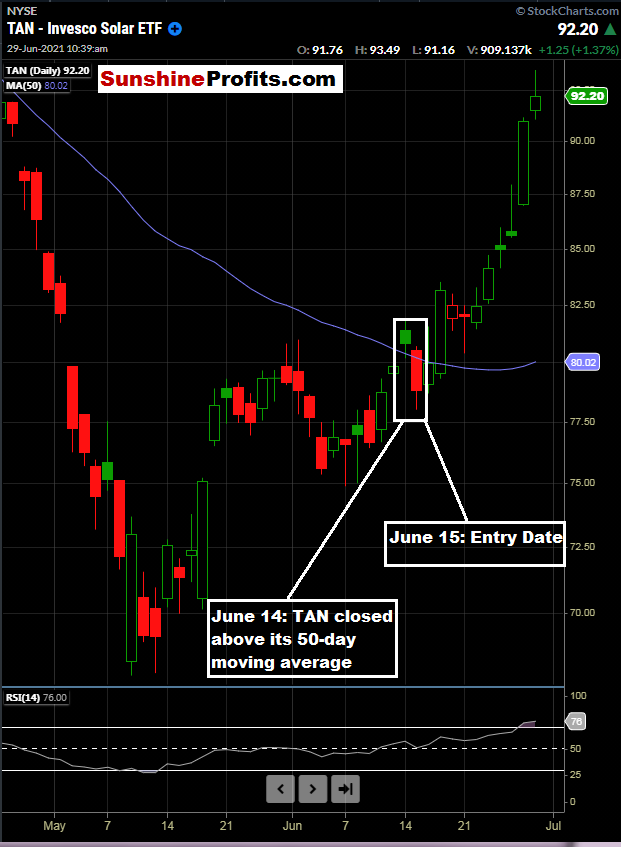
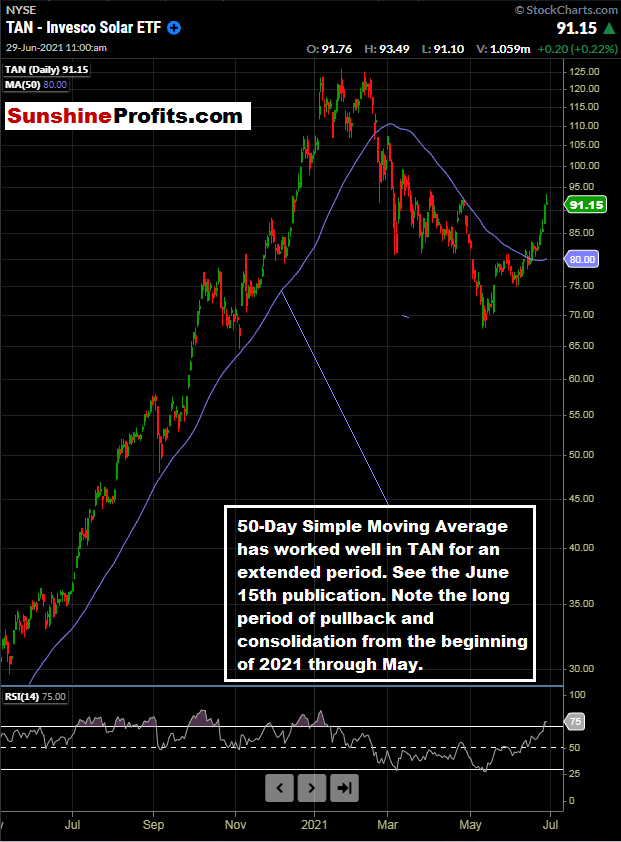
Figure 2 - TAN Invesco Solar ETF April 27, 2021 - June 29, 2021, Daily Candles Source stockcharts.com
On June 14th, TAN closed above its 50-day moving average for the first time in a long time. While this entry seems like more of a momentum-based entry, it is important to note that TAN had undergone a long period of consolidation and pullback.

Figure 3 - TAN Invesco Solar ETF May 8, 2020 - June 29, 2021, Daily Candles Source stockcharts.com
So, in this case, we identified a market with a good theme that has pulled back for an extended period. For a trigger, a close above the 50-day SMA made sense.
Let’s take a look in more detail at TAN for any premium subscribers that have open positions. Did I mention that TAN was the top-performing ETF of all unleveraged ETFs yesterday? It was up 6.29% on June 28, 2021.
Not a Premium subscriber yet? Go Premium and receive my Stock Trading Alerts that include the full analysis and key price levels.
Thank you for reading today’s free analysis. If you would like to receive daily premium follow-ups, I encourage you to sign up for my Stock Trading Alerts to also benefit from the trading action described - the moment it happens. The full analysis includes more details about current positions and levels to watch before deciding to open any new ones or where to close existing ones.
Thank you.
Rafael Zorabedian
Stock Trading Strategist -
VIX at Pre-Pandemic Levels, Summertime Volatility Possible?
June 28, 2021, 9:19 AMAs the S&P 500 marches on, the VIX is trading at pre-pandemic levels. Will the fear index remain subdued all Summer, or could a return of volatility be in the cards?
Last week seemed to be one of those weeks where the market could do no wrong. After digesting the previous week’s interest rate stance changes from the Fed, the S&P 500 just kept climbing and climbing last week, reaching all-time highs once again. Weak economic data print via Flash Services PMI? No problem; market higher. Unemployment Claims printing higher than expected? Also, no problem. Weak New Home Sales print? The market said no problem. The S&P 500 had plenty of upside to get last week, and it got it. What about this week?

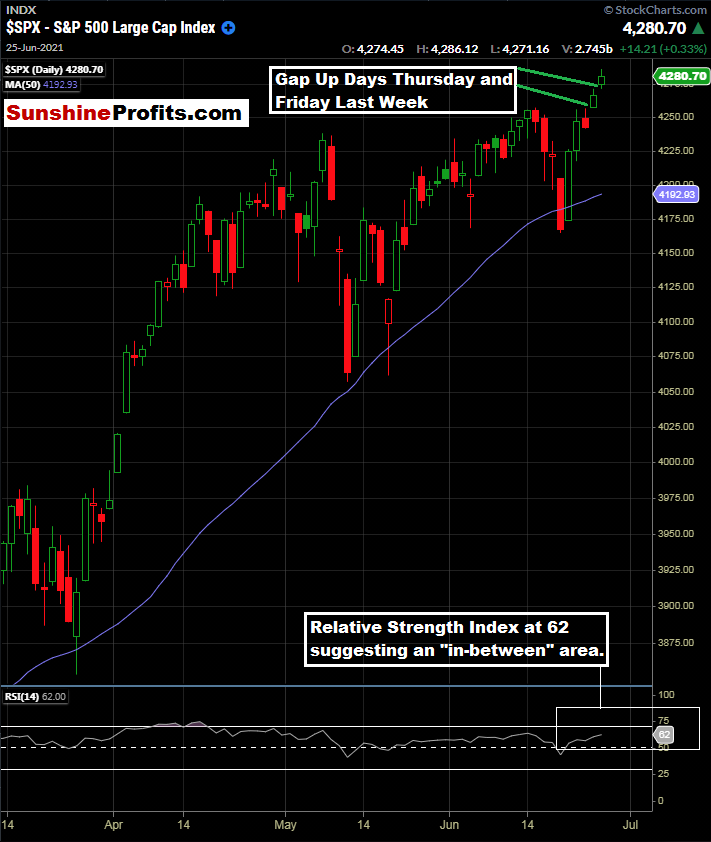
Figure 1 - S&P 500 Index March 13, 2021 - June 25, 2021, Daily Candles Source stockcharts.com
Towards the end of last week, we had two gap higher opens in a row; on Thursday and Friday. At the same time, we really do not have an extreme overbought condition via RSI(14), with the reading at 62. We closed at all-time highs on Thursday and Friday, and things have been looking rosy for the bulls.
So, while we were having these strong up days at the end of last week, I started watching the $VIX intraday, looking at not only the cash $VIX; but the front-month VX futures as well. I indeed noticed a solid bid under the market (especially in the VX front-month futures). While the volatility was still lower, there was indeed some bid to the market; you could just feel it and see it by watching. So, let’s take a look at the $VIX:

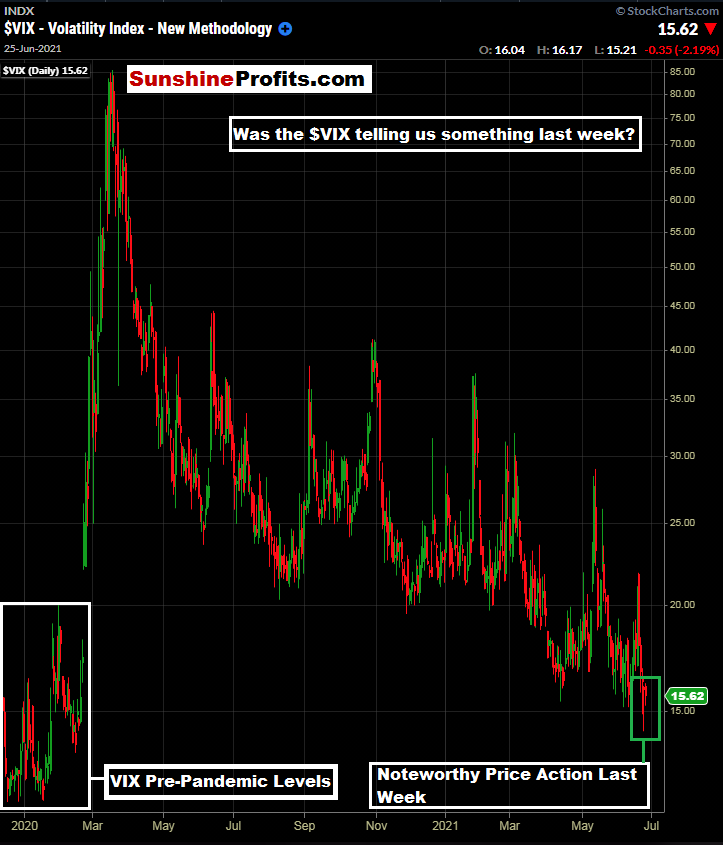
Figure 2 - $VIX Volatility Index December 9, 2019 - June 25, 2021, Daily Candles Source stockcharts.com
Above, we see the $VIX at its pre-pandemic levels and our current levels. What caught my eye last week (especially on Thursday and Friday) was the bid under the Volatility Index, even as the S&P 500 advanced higher and made all-time highs on gap-up days.
While the $SPX and $VIX do not have a 100% inverse correlation, they are certainly inversely correlated for the most part. Let’s take a more zoomed-in look at the daily price action late last week:

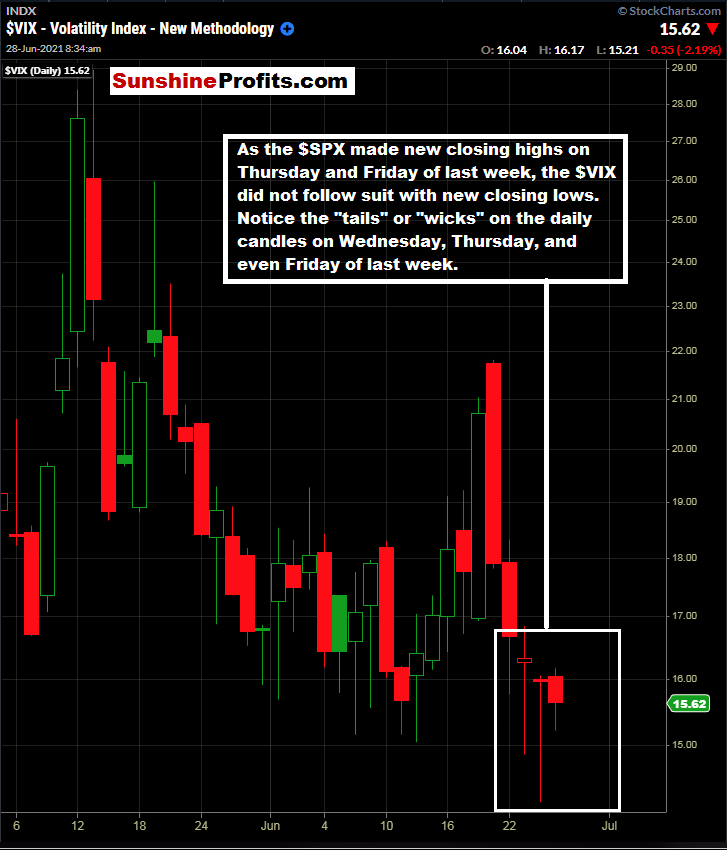
Figure 3 - $VIX Volatility Index May 5, 2021 - June 25, 2021, Daily Candles Source stockcharts.com
Divergences like we see here really capture my attention. Clearly, there was a bid under the Volatility Index last week, even as the $SPX was trading new highs.
It only makes sense. Money managers of all kinds are wise to use all-time highs to hedge portfolios by purchasing protection in the form of $VIX calls when volatility is low. Could this be a prelude to things to come over the Summer? What do you think?
It seems that we are at an “in-between” point of some sorts. While the $SPX is not flashing any extremely overbought technical warning signs, it has risen quickly from its 50-day moving average. Combining that fact with the price action in the $VIX last week, it all paints an inconclusive picture for me at the moment.
I think it is wise to be in tune with the state of the $SPX and $VIX; and their relationship with one another.
This week, we have the big Non-Farm Payroll data on Friday, and the market will be waiting for that data. The above-described divergence could be a sign of overall sideways price action heading into the number on Friday.
Now, for our premium subscribers, let’s examine the nine markets that we are covering. At least one of them is primed for an exit today, so let’s dig right into it. Not a Premium subscriber yet? Go Premium and receive my Stock Trading Alerts that include the full analysis and key price levels.
Thank you for reading today’s free analysis. If you would like to receive daily premium follow-ups, I encourage you to sign up for my Stock Trading Alerts to also benefit from the trading action described - the moment it happens. The full analysis includes more details about current positions and levels to watch before deciding to open any new ones or where to close existing ones.
Thank you.
Rafael Zorabedian
Stock Trading Strategist
Free Gold &
Stock Market Newsletter
with details not available
to 99% investors
+ 7 days of Gold Alerts
Gold Alerts
More-
Status
New 2024 Lows in Miners, New Highs in The USD Index
January 17, 2024, 12:19 PM -
Status
Soaring USD is SO Unsurprising – And SO Full of Implications
January 16, 2024, 8:40 AM -
Status
Rare Opportunity in Rare Earth Minerals?
January 15, 2024, 2:06 PM

