

-
NFP Numbers Miss, Yet Equities Higher, and What We Got Right About ETFs
June 7, 2021, 8:30 AMAs the NFP jobs number missed expectations of 645K-665K, with a print of only 559K, the equity indices jumped higher. What gives?
This lower print could be a prelude to the next Fed meeting, which happens on June 15-16. Weak job growth could give the Federal Reserve a reason to continue with the "lower for longer" theme and more dovish signals. The Ten-Year note yield moved lower on Friday off the jobs data, while the Nasdaq surged. Tech has been moving inversely to bond yields at a decent correlation in recent months and could be a sign of things to come.

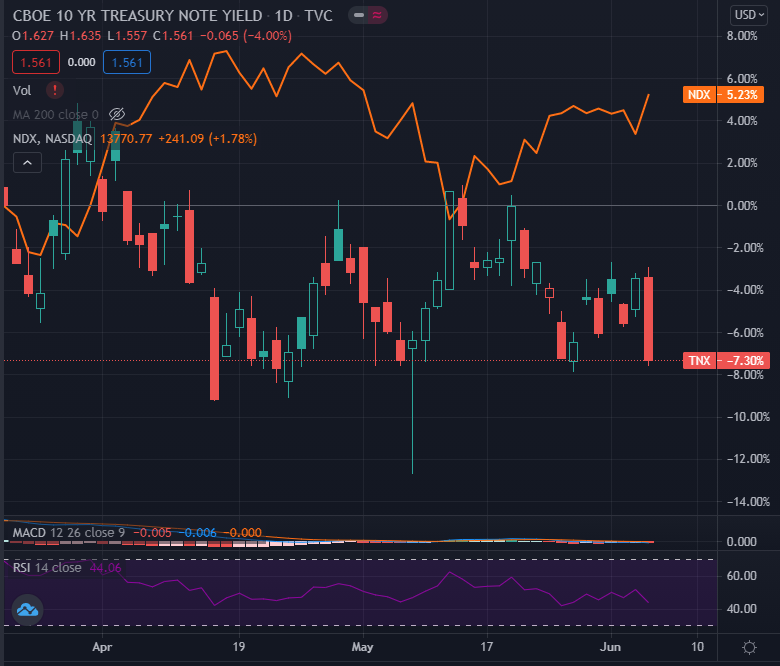
Figure 1 - $TNX 10-Year Note Yield (candlesticks) compared to $NDX Nasdaq 100 Index (sold red line) -March 23, 2021, - June 4, 2021, Source tradingview.com
Above, we can see the mostly negative correlation between the $TNX 10-Year Note yield (candlesticks) and the $NDX Nasdaq 100 Index (red line).
The Nasdaq 100 led all indices on Friday, tacking on 1.78%, while the 10-Year Note yield lost 4.00%, to settle at 1.561%. There is a Fed meeting approaching, and with the other major indices settling close to all-time highs on Friday, a breakout to the upside in the major indices could lead to lower yields. Will the weak jobs number be the Fed’s fundamental catalyst to more dovish inclinations?
The possibility exists.
Review of Our Latest ETF Picks
Now that the big jobs number is out of the way, and since we have covered so much during the month of May and into early June, I thought it would be an opportune time to recap some of the existing markets that we are following in greater depth. Let’s jump right in:
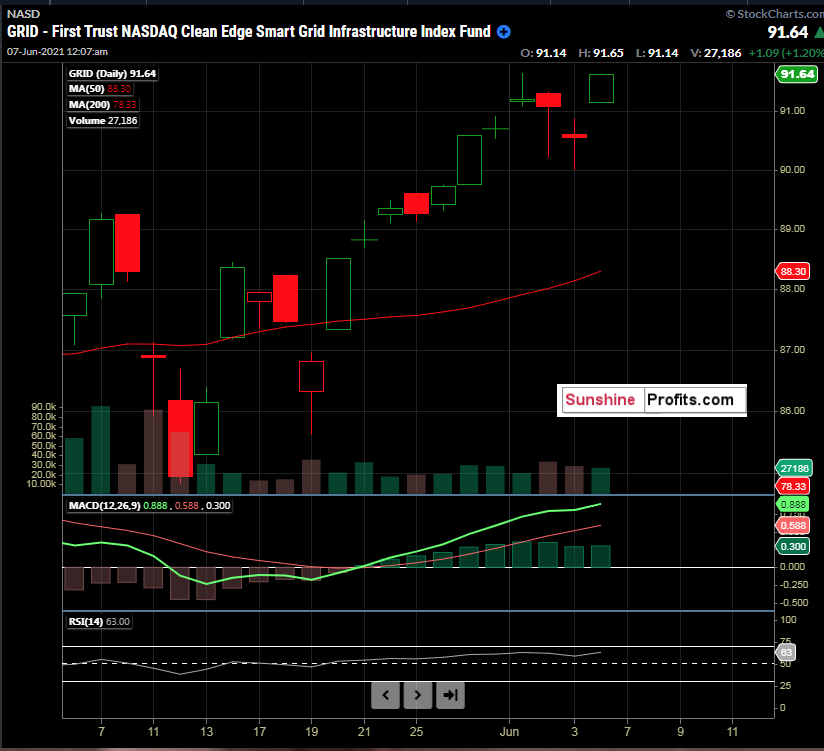
- (GRID) First Trust NASDAQ Clean Edge Smart Grid Infrastructure Index Fund. GRID analysis was first introduced in the May 6. 2021 publication with an idea buy level between $86.91 and $88.17.
The idea level was traded through between May 11 - May 13. GRID settled on Friday, June 4, at $91.64.
 Figure 2 - First Trust NASDAQ Clean Edge Smart Grid Infrastructure Index Fund (GRID) Daily Candles May 6, 2021 - June 4, 2021. Source stockcharts.com
Shorter-term traders could have used the old 52-week high as an exit ($90.96) as mentioned in the May 6. 2021 publication. However, I continue to like this name given the infrastructure bill and will keep readers apprised of daily overbought technical levels and other ideas for exits in upcoming publications.
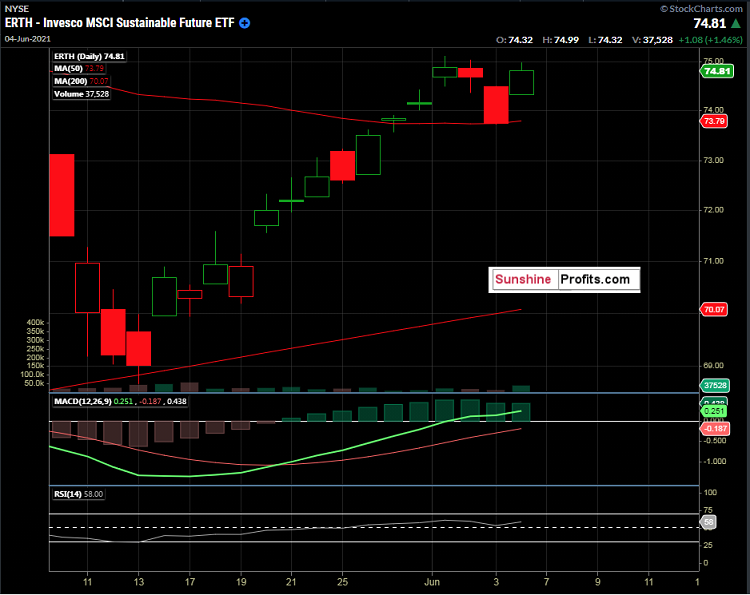
2. (ERTH) Invesco MSCI Sustainable Future ETF. ERTH analysis was first introduced in the May 10. 2021 publication with an idea buy level between the 200-day moving average and a key 61.8% retracement level. On May 10th, these levels were $67.76 - $68.49.

Figure 3 - Invesco MSCI Sustainable Future ETF (ERTH) Daily Candles May 10, 2021 - June 4, 2021 Source stockcharts.com
ERTH traded to its 200-day moving average on May 13, 2021; albeit briefly (see above). ERTH settled on Friday, June 4, at $74.81.
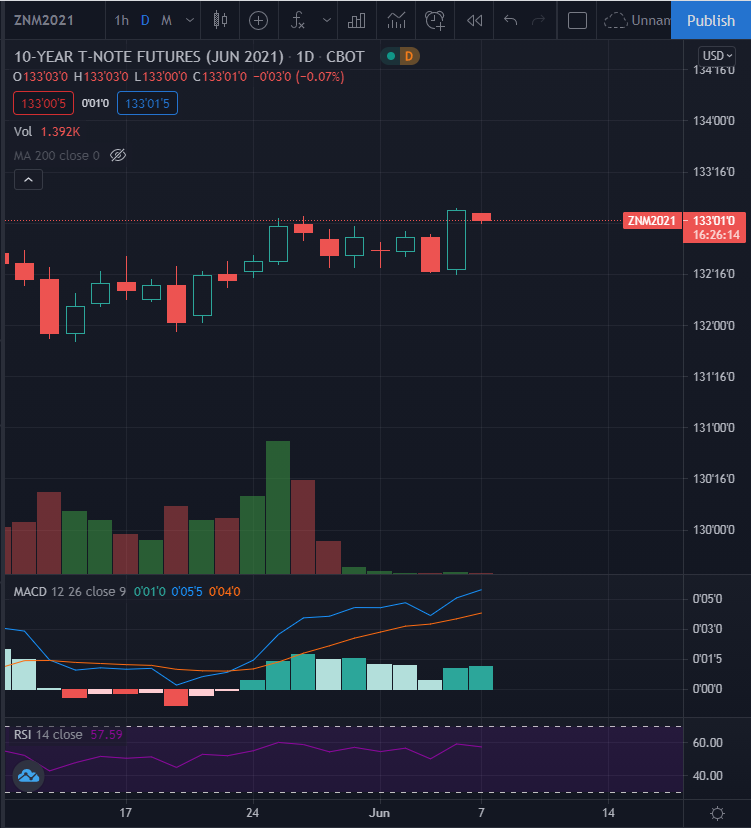
3. In the May 11, 2021 publication, we explored the 10-Year note yield. On that day, the June contract (ZNM2021) was the front-month and active contract. Since then, the contract roll has occurred, and September is now the active contract. The outlook on May 11, was for potentially higher yields, and lower prices. The idea zone to sell the June 10-year notes (ZNM2021) was 132'22 - 132'24'5 with a tight stop in the May 11th publication. We also revisited the idea on May 20th.

Figure 4 - June 10-Year notes May 11, 2021 - June 7, 2021, 12:40 AM ET Daily Candles Source tradingview.com
10-year notes had remained largely rangebound until Friday’s NFP jobs number and then moved higher off the data. Given the upcoming Fed meeting on June 15-16, and the move higher in the 10 Year note futures (lower $TNX yields) on Friday, my inclination is to be out of the 10-year notes at this time. Should equities move higher and rates lower, it would not be wise to be short the 10-year notes. Time will tell, but for me, I think there are other better places to be right now.
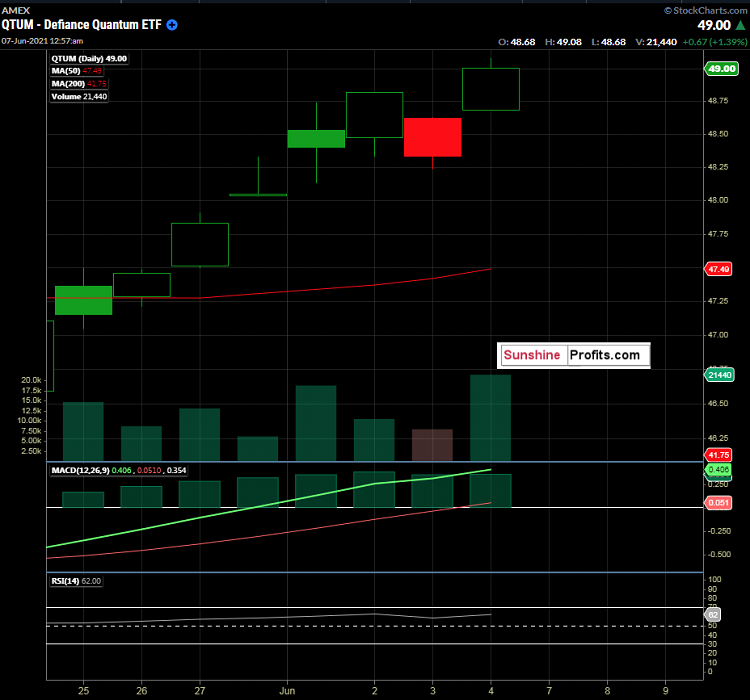
4. On May 25th, we discussed automation, artificial intelligence, and QTUM - Defiance Quantum ETF with a long entry idea between $44.00 - $47.25 (50-day moving average). It traded in this zone on May 25th, with a low of $47.05 and the next day (May 26th) made an intraday low of $47.21. QTUM closed on Friday, June 4, at $49.00.

Figure 5 - QTUM Defiance Quantum ETF Daily Candles May 25, 2021 - June 4, 2021. Source stockcharts.com
5. In our May 27th publication, we examined the Russell Index reconstitution. It is a very curious yearly phenomenon that results in a newly balanced index on June 28th, 2021. We focused on the Russell 2000 Index via the IWM. IWM closed at $225.65 on May 27th and settled at $227.40 on Friday, June 4th.
Let’s also keep in mind that we have CPI data coming out this Thursday, June 10, at 8:30 AM ET.
(The full version of today’s analysis includes 5 buy opinions, 1 sell opinion, and 1 hold opinion)
Thank you for reading today’s free analysis. If you would like to receive daily premium follow-ups, I encourage you to sign up for my Stock Trading Alerts to also benefit from the trading action described - the moment it happens. The full analysis includes more details about current positions and levels to watch before deciding to open any new ones or where to close existing ones.
In particular, I encourage you to do so right now, as we just launched a promotion that allows you to subscribe for just $9 for the first TWO weeks! Subscribe at this preferred rate today.
Thank you.
Rafael Zorabedian
Stock Trading Strategist -
Non-Farm Payrolls in Focus – Watch Out for Expected Price Volatility
June 4, 2021, 6:26 AMAvailable to premium subscribers only.
-
US Equities: Mixed Signals, Inflation, Waiting Game
June 2, 2021, 11:13 AMThe June E Mini S&P 500 futures contract traded well early yesterday morning before the cash open. Cash traders, however, had different ideas when the opening bell rang in New York.
The June E mini S&P 500 (ESM2021) traded as high as 4230.00 right at 9:31 AM yesterday (June 1) as cash trading began. Traders were waiting on the PMI data release at 10:00 AM. Sellers came into the market right at the cash open, selling it down to 4213.00 in the minutes leading up to the data print. The data signaled inflation once again, with the PMI data printing 62.1, above market expectations of 61.5, and above the last measure of 61.5. Inflation became a concern here. Will the Fed eventually raise their overnight Fed Funds Rate? Will yields rise? This data print created uncertainty in the market, and the ESM2021 settled around 4199.75 at 4:15 PM ET yesterday.
This type of price action came as no surprise to me, as the prevailing macro theme of this week seems to revolve around Friday’s Non-Farm Payroll data. As mentioned yesterday, I view this type of trading week as “sideways trading in a wide range in the $SPX until the market gets a read on the NFP data.” Let’s see how this plays out heading into Friday.
The Cash $SPX settled almost flat, giving up 2.09 points (-0.05%) on the day. That’s what I would call sideways. The $VIX, however, tacked on 6.80%, furthering the potential of yesterday’s weekly outlook for volatility to get bid up this week, as the market waits for Friday’s jobs number. S&P 500 options implied volatilities got more expensive, with the uncertainty of Friday’s jobs number being a partial contributor.

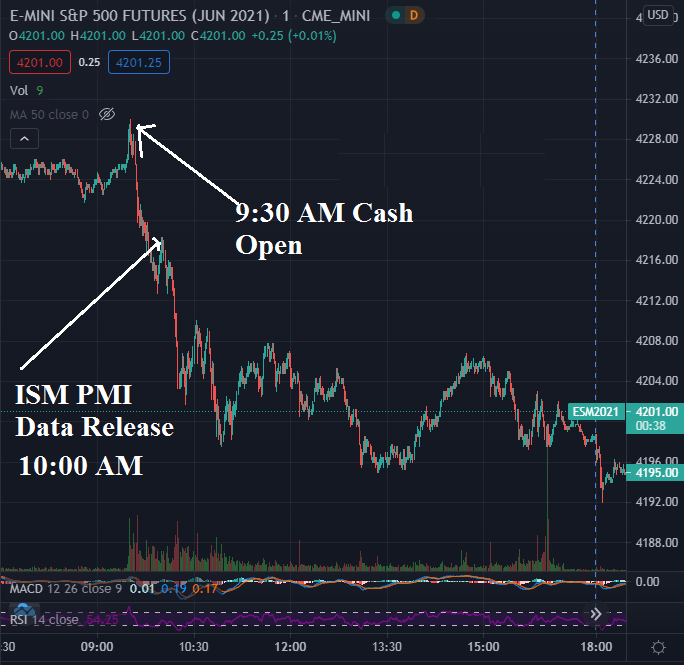
Figure 1 - June Emini S&P 500 Futures 7:30 AM June 1, 2021 - 6:46 PM June 1, 2021 One-Minute Candles Source tradingview.com
A picture is worth a thousand words. In the above chart, we can see how the cash S&P 500 open was sold, and how the PMI print was sold.
However, with muted trading expected this week in a range, this doesn’t seem too surprising. The $SPX closed flat on the day, and the $VIX caught a bump. So, what would be the expected ranges for Wednesday’s and Thursday’s session?
We could actually consult the weekly options and determine the price range probabilities for the week, but that will include Friday trading data. Let’s just examine the recent ranges to get an idea for Wednesday and Thursday.

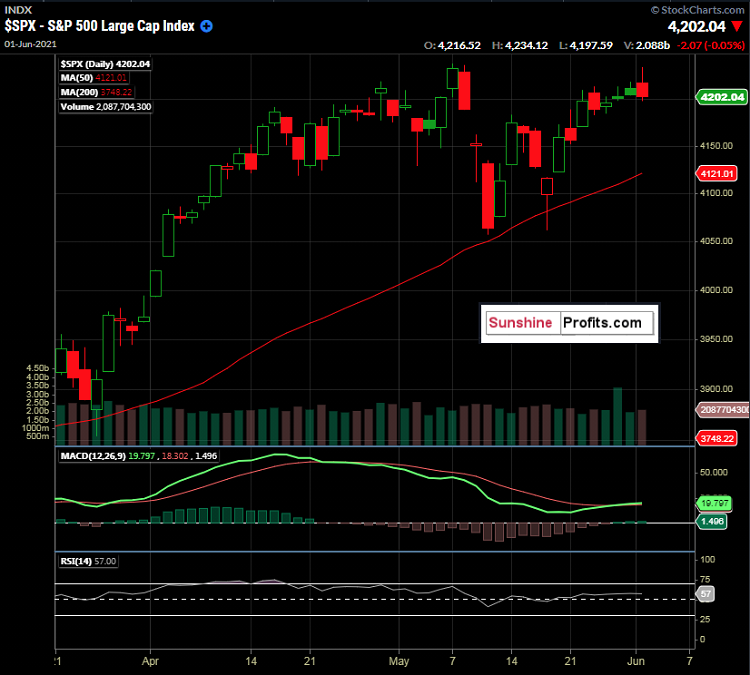
Figure 2 - S&P 500 Index $SPX March 25, 2021 - June 1, 2021, Daily Candles Source stockcharts.com
We can see that today’s high prints in the index (4234.12) at the US cash market open were getting close to the all-time high of 4238.04, set on May 7th. This level was denied and seems to lend some credibility to a rangebound market ahead of Friday’s NFP data.
The 50-day SMA sits at 4121.01 and this coincides well with the lows of the range towards the end of April, near 4118.00 - 4125.00. These figures could give us a range to look for over the next couple of days. Could volatility strike before the data? It could, however, I would expect it to be short-lived and mild. Nobody knows for sure, but let’s look for a rangebound $SPX on Wednesday and Thursday.

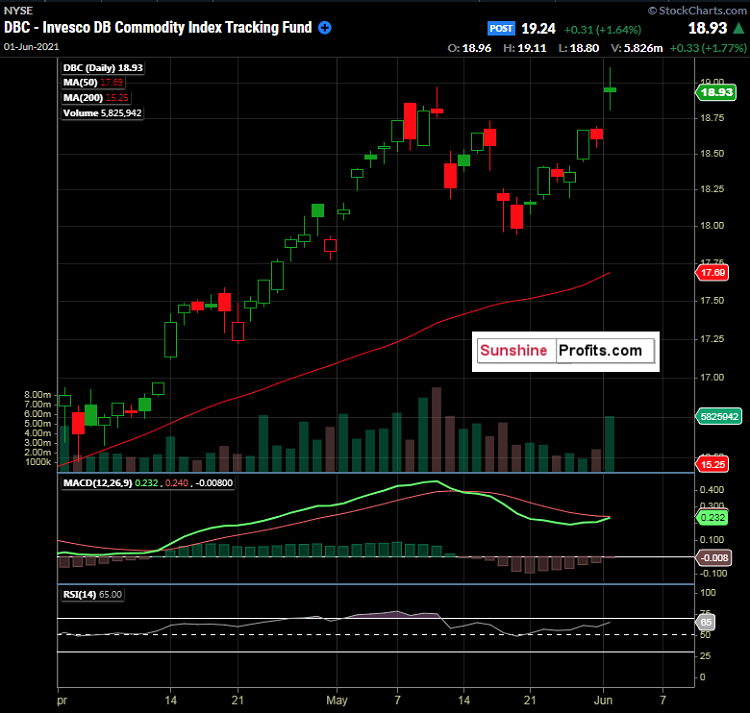
Figure 3 - Invesco DB Commodity Index Tracking Fund DBC April 1, 2021 - June 1, 2021, Daily Candles Source stockcharts.com
With inflation back in the spotlight yesterday, commodities rose overall, as can be seen in the above daily chart of DBC. In addition, there is news of the JBS Beef Plant Cyberattack that did not help with the inflationary theme. However, there is now news that the plans are coming back online.
The daily candle that was formed here could be an abandoned baby bear or exhaustion gap; note the gap up with the open and close levels almost identical. We will have to see how commodities trade tomorrow to see if this new high holds.
Now, for our premium subscribers, let's recap the markets and key levels that we are covering. Not a Premium subscriber yet? Go Premium and receive my Stock Trading Alerts that include the full analysis and key price levels.
Thank you for reading today’s free analysis. If you would like to receive daily premium follow-ups, I encourage you to sign up for my Stock Trading Alerts to also benefit from the trading action described - the moment it happens. The full analysis includes more details about current positions and levels to watch before deciding to open any new ones or where to close existing ones.
Thank you.
Rafael Zorabedian
Stock Trading Strategist -
Your Week Ahead: PMI, Payrolls, Ranges, and Higher Volatility?
June 1, 2021, 9:03 AMThinking back to 2007 - 2008, I remember a time when the economic data just kept coming out rosy, even though I deeply suspected there was an underlying shoe to drop due to real estate and overlending. At the time, it seemed like every economic print was bullish, and the $SPX just kept climbing and climbing. It can be frustrating; when you may have the correct outlook, but just too early.
This concept is one of the most important things a trader can recognize; his or her timing. The market will dictate when you are right, and your wallet will reflect the harsh reality of when you are wrong.
With that being said, we turn our attention to the big data releases scheduled for June.
The Big One: Traders are looking to the Non-Farm Payrolls report on Friday, June 4th, at 8:30 AM ET. The market is expecting a gain of 645K - 670K here after last month's huge miss of 266K actual vs. 990K expected. Friday ought to be a doozy, with Fed Chair Powell speaking beginning at 7:00 AM ET and then the big jobs number.
But before we get to Friday, the ISM Manufacturing PMI is slated for release on Tuesday, June 1st, at 10:00 AM ET. This data will give market participants a view into business conditions, including employment, supplier deliveries, production, and more. This data release can be viewed as a precursor or clue to Friday’s Non-Farm Payroll Data. Then there is ISM Services PMI on Thursday. It is a big week for economic data releases in the US, with the granddaddy of all of them on Friday.
So, heading into the week, what is the S&P 500 telling us?

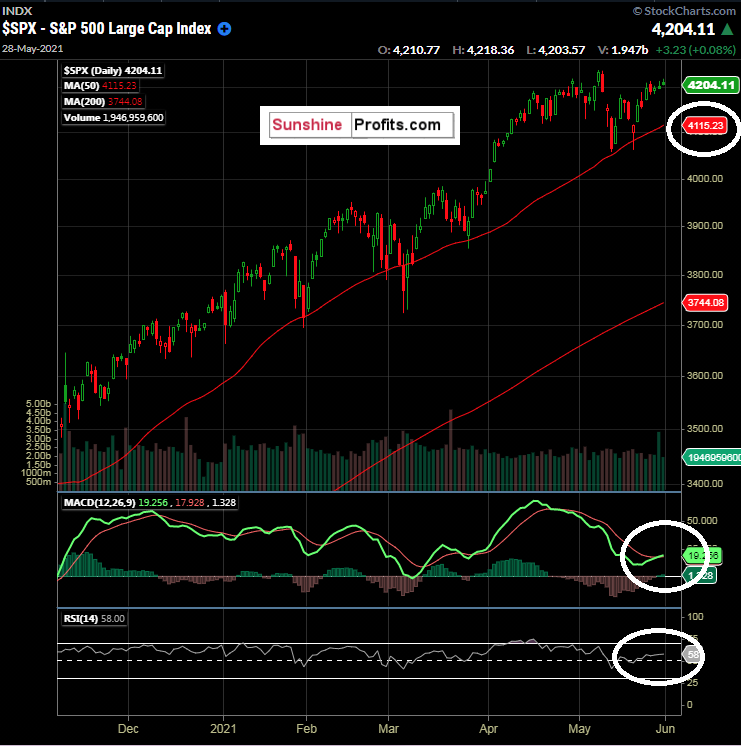
Figure 1 - $SPX S&P 500 SPX November 6, 2020 - May 28, 2021 Daily Candles Source stockcharts.com
There are several interesting things happening with the S&P 500. Coming out after a practically flat month of May (thanks to jobs data and inflation data), we see the MACD(12,26,9) throwing a bullish signal here, with the fast line crossing the slow line. RSI(14) is above 50, and we are currently trading well above the 50-day SMA of 4115.23.
While it may not seem logical, most signs seem bullish at this time, after a month of sideways trading and consolidation. One could reason that the jobs data and inflation that has been gaining steam should hurt the index. However, wouldn’t inflation make stocks more expensive too? It is something to think about. We have to keep a pulse on the US Dollar Index for clues.
What is happening in the $VIX?

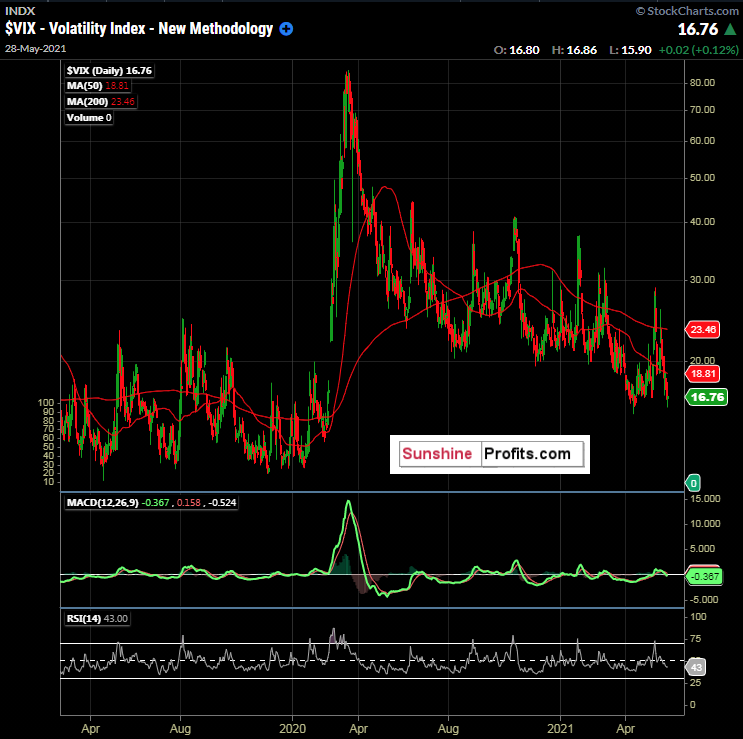
Figure 2 - $VIX Volatility Index 2000 ETF February 21, 2019 - May 28, 2021 Daily Candles Source stockcharts.com
There are no surprises here in the $VIX over the longer term. The massive spike caused by the pandemic has been steadily sold, with options sellers sucking up premiums akin to a vacuum cleaner. Although, there have been spikes along the way. Around the close on Friday, the $VIX caught my eye due to its close as the $SPX gave up around 10 handles between 3:00 PM and 4:00 PM ET.

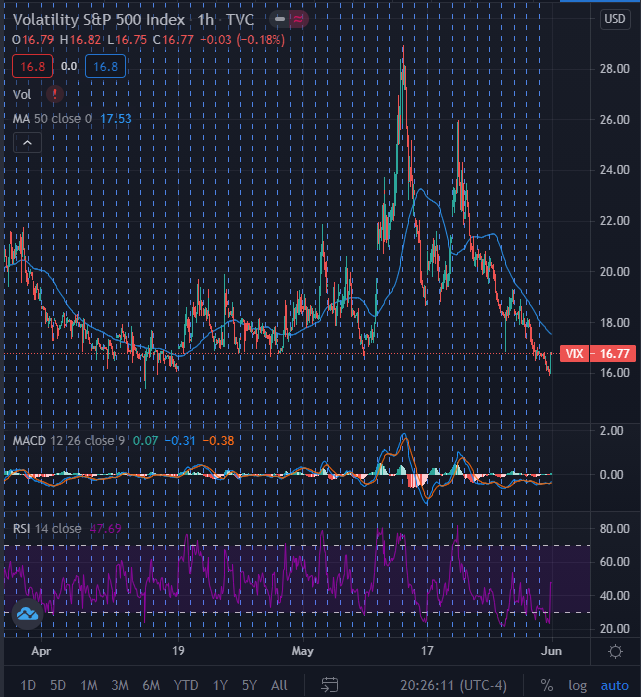
Figure 2 - $VIX Volatility Index 2000 ETF March 29, 2021 - May 28, 2021 Hourly Candles Source tradingview.com
The hourly candles show $VIX down near its April lows and catching a nice hourly pop on Friday near the close. Friday was the last day of the month, so there could have been some book squaring and month-end activity that contributed to the pop. It was nothing outrageous, but this action coupled with being near the bottom end of the recent range caught my attention.
There are some mixed signals for the S&P 500 at the moment.
Since this week has so much data coming in, I would expect volatility to get bid up and options to become more expensive due to higher implied volatility. Given the flat month of May in the $SPX, I would view it as an overall bullish continuation pattern when factoring in the daily technicals. However, at the same time, the $VIX is near its lower end of the range.
Therefore, I am prepared for sideways trading in a wide range in the $SPX until the market gets a read on the NFP data.
Now, for our premium subscribers, let's further review the $SPX and the other markets and key levels that we are covering. Not a Premium subscriber yet? Go Premium and receive my Stock Trading Alerts that include the full analysis and key price levels.
Thank you for reading today’s free analysis. If you would like to receive daily premium follow-ups, I encourage you to sign up for my Stock Trading Alerts to also benefit from the trading action described - the moment it happens. The full analysis includes more details about current positions and levels to watch before deciding to open any new ones or where to close existing ones.
Thank you.
Rafael Zorabedian
Stock Trading Strategist -
Russell 2000 Closes Above 50-Day SMA. Reconstitution Play!
May 27, 2021, 10:21 AMDo you have exposure to small-cap equities? How do the small-caps measure up versus the large-caps at this moment?
There is always opportunity somewhere, and we do our best to find it. Not only in trading and business, but in life too. So, what can we find today in the markets?
Yesterday, the Russell 2000 ($RUT) closed above its 50-day simple moving average, a welcome sign for small-cap bulls. The index has lagged behind its large-cap counterparts as of late and hasn’t closed above its 50-day moving average since May 7th.
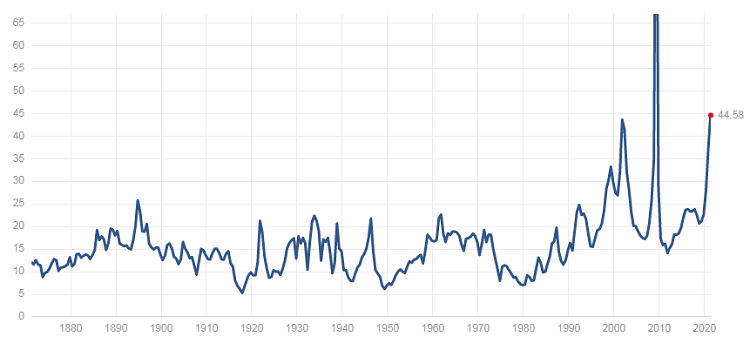
After taking the pulse of the markets and digesting the opinions of other participants, it can be challenging to get excited about an $SPX at 4200 and with a 44.58 P/E ratio (trailing twelve months). So, more aggressive swing traders tend to look elsewhere in the hunt for return.
A quick note on the $SPX P/E ratio (ttm):
 Figure 1 - S&P 500 PE Ratio 1870 - 2021. Source multpl.com
Talk about a long-term chart. Anyway, this does look like a potential head and shoulders setup here, although it looks like current levels have exceeded the neckline. Food for thought. At what point is the S&P 500 fundamentally overvalued?
Let's get back to small caps.

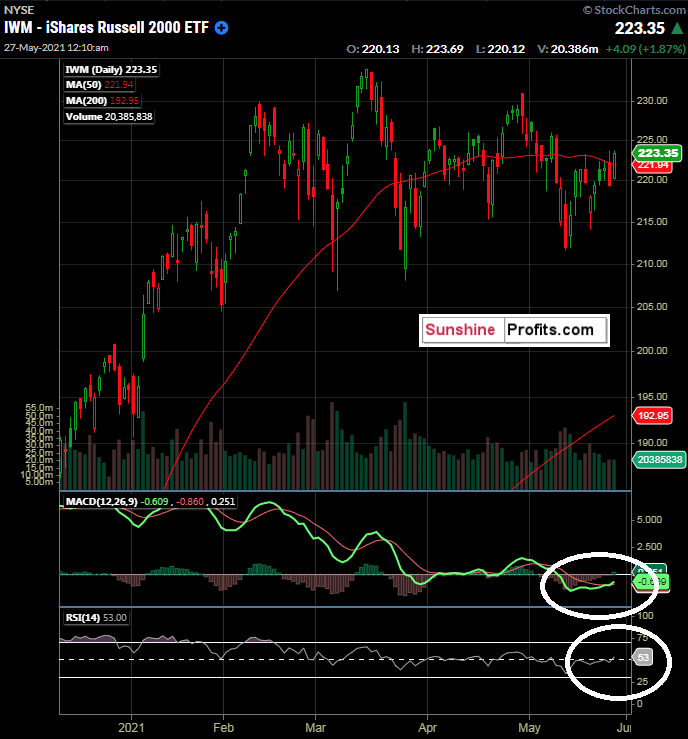
Figure 2 - IWM iShares Russell 2000 ETF December 10, 2020 - May 26, 2021. Source stockcharts.com
Above, we see the close above the 50-day moving average, the MACD(12,26,9) fast/slow line cross approaching the zero line, and the RSI(14) crossing 50. This, my friends, is visual Mozart to me; a confluence of indicators. Of course, nothing works all of the time, but when multiple technicals can be stacked in your favor, a distinct advantage can be created.
Wednesday’s settlements had the SPY up 0.20% on the day, the DIA up 0.03%, the QQQ up 0.35%, and the IWM up 1.87%. A whopping change in tune from the recent large-cap money flow theme. It is certainly worth noting and perhaps utilizing for adjustment and/or speculation.
Why Were the Small-caps Up So Much Comparatively on Wednesday?
One thing to know is that the Russell indices are reconstituted yearly in June. This reconstitution is designed to remove underperforming stocks from the index and add new stocks to the index. The goal is to have and maintain a more accurate representation. This process begins on June 4, 2021, and ends with the reconstituted index ready on June 25. The new index components take effect after the market closes on June 25, which would be for Monday’s open on June 28.
Isn’t this a valuable nugget?
Another viable way to play the Russell reconstitution would be to pair it with another index ETF like SPY. If you are overall bearish on the market, this could be a great way to reduce risk, and still participate in the “Russell reconstitution trade”.
Take a look:

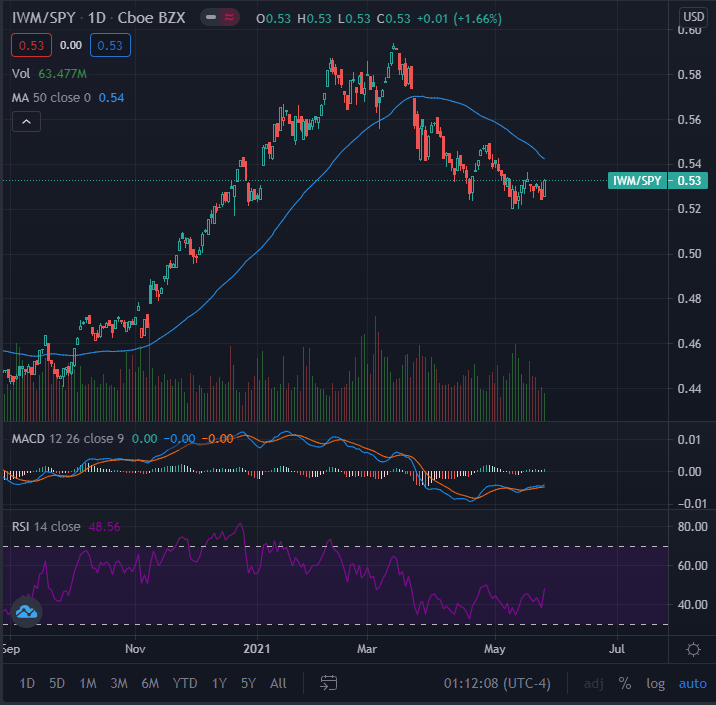
Figure 3 - IWM iShares Russell 2000 ETF / SPY S&P 500 ETF Ratio August 27, 2020 - May 26, 2021. Source stockcharts.com
This chart is the IWM divided by the SPY. The IWM to SPY ratio. You can see that the small-cap index had fallen out of favor versus the large-cap index from March until now. Again here, we see the MACD looking to tilt bullish and the RSI(14) looking to bullishly cross the 50 line.
So, this can be a way to take advantage of the Russell Index reconstitution even if you are bearish. This can be achieved by buying IWM and selling SPY, on a dollar-for-dollar basis. It is a way to look for one index to outpace the other (or not decrease as much as the other). Got it?
Now, for our premium subscribers, let’s examine some strategy ideas that surround the Russell 2000 reconstitution and review the other markets and key levels that we are covering. Not a Premium subscriber yet? Go Premium and receive my Stock Trading Alerts that include the full analysis and key price levels.
Thank you for reading today’s free analysis. If you would like to receive daily premium follow-ups, I encourage you to sign up for my Stock Trading Alerts to also benefit from the trading action described - the moment it happens. The full analysis includes more details about current positions and levels to watch before deciding to open any new ones or where to close existing ones.
Thank you.
Rafael Zorabedian
Stock Trading Strategist
Free Gold &
Stock Market Newsletter
with details not available
to 99% investors
+ 7 days of Gold Alerts
Gold Alerts
More-
Status
New 2024 Lows in Miners, New Highs in The USD Index
January 17, 2024, 12:19 PM -
Status
Soaring USD is SO Unsurprising – And SO Full of Implications
January 16, 2024, 8:40 AM -
Status
Rare Opportunity in Rare Earth Minerals?
January 15, 2024, 2:06 PM

