

-
The ETF You Want for a Sustainable Future
May 10, 2021, 8:29 AMWant to trade and be a part of climate change innovation? There’s an ETF that will you give you exposure to companies leading the fight against climate change.
Greetings. I hope you enjoyed the weekend and have come into the new week rejuvenated and relaxed.
As I search through instruments, looking for potential opportunities, one thing stands out: most US equity ETFs and indices seem overbought. That’s okay, though. A bull market like this is bound to reach overbought conditions. In my opinion, it’s important to wait for a pullback before going long. Buying the dips is a good idea in bull markets. It’s so simple, right? Yet, do we always do that?
As a result of many instruments bearing a similar-looking price chart and an overbought common technical theme, I’ve begun to look for some things that have fallen out of favor recently in an attempt to find value. We all know that the sector rotation from growth to value was the theme earlier in 2021. There were outflows from tech, and capital found its way to Dow 30 stocks and the like, as investors hunted for value with dividend yield.
During my scanning and filtering in an attempt to find some potential opportunities that have pulled back or consolidated, I ran into an interesting product, the Invesco MSCI Sustainable Future ETF (ERTH). ERTH holds worldwide companies that make efficient use of natural resources in a limited way: pollution prevention, alternative energy, green building, and sustainable agriculture are parts of the holdings. This ETF was catapulting higher approaching the US presidential election, reaching a high of $83.72 in January 2021. Let’s begin by taking a look at the daily chart.

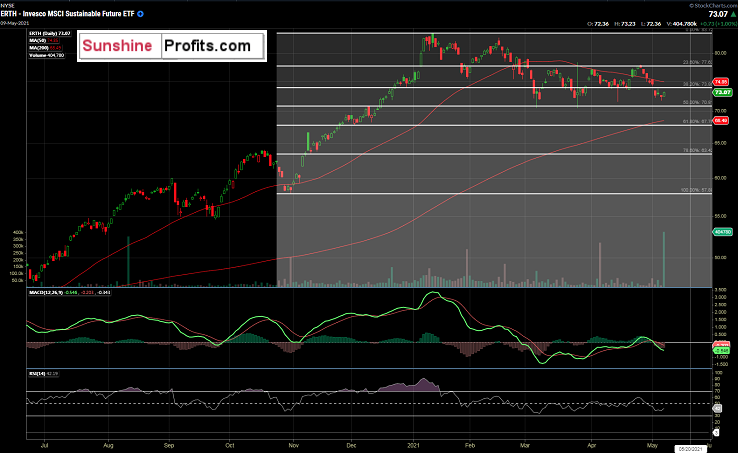
Figure 1 -Invesco MSCI Sustainable Future ETF (ERTH) Daily Candles June 23, 2020 - May 7, 2021. Source stockcharts.com
Here we can see the price uptrend in 2020 with the high of $83.72 reached on January 12, 2021. Since then, we have seen the price trend lower to sideways, which appears to be a healthy bull market consolidation pattern. I like to see consolidations such as this in a market trending upward. Looking at it further, it is currently trading below its 50-day moving average of $74.85 and the last trade price on May 7, 2021, of $73.97. What sticks out to me here is the huge volume that traded on May 7, 2021, with 404,780 shares traded. This activity is the highest daily volume for ERTH throughout this chart. It seems that somebody or some entity wanted or needed to get long ERTH on Friday.
Next, we can see that the product has indeed been making higher lows since March 5, 2021. Notice how the first two of these higher lows closely coincided with the 50% Fibonacci retracement of $70.81. The daily MACD has crossed the zero line recently, which portended lower prices to come. The Daily RSI reading is around 42 and could cross the 50 line if prices increase in the short term, which would be a bullish signal.
However, whenever possible, I like to prepare for an entry on a pullback. I realize that, right now, it feels like the broader markets will never pull back. This is all the more reason that there could be some kind of pullback in the cards in the broader indices at some point in the near future. So, in preparation for a broader market pullback, I look for the next level where there could be buyers of ERTH. A broad market pullback could send most instruments lower, and if that happens, it is always great to have a premeditated plan for entries. Keeping this in mind and seeing that ERTH is trading below its 50-day moving average, I begin to think about the 200-day moving average.

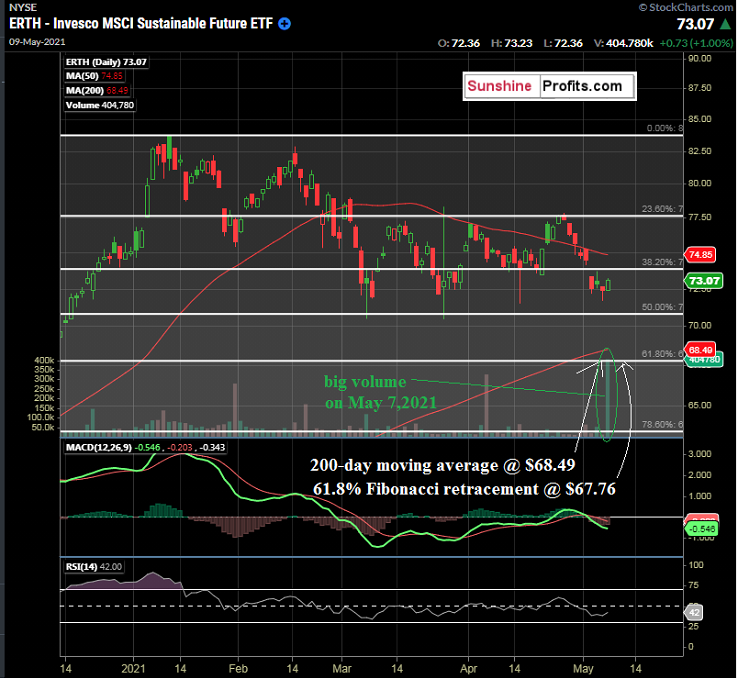
Figure 2 -Invesco MSCI Sustainable Future ETF (ERTH) Daily Candles December 14, 2020 - May 7, 2021. Source stockcharts.com
Here we can see the 200-day moving average at $68.49 and the 61.8% Fibonacci retracement level taken from the October 30, 2020, low and the January 12, 2021 high. This indicator confluence is visual music to my ears.
The question now becomes, will it pull back to these levels, or will the higher lows pattern hold as support? That is the million-dollar question in ERTH. I see the broader indices pulling back at some point, soon potentially affecting ERTH, which leads me to play the waiting game. I prefer to be waiting with dry powder on hand versus being in a losing trade waiting for the market to go back my way.
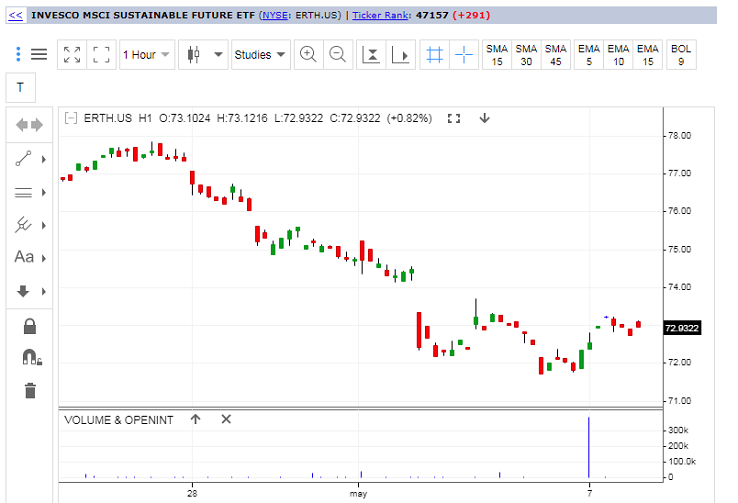
To become more confident in my viewpoint, I dig into the hourly chart, which shows the recent downtrend more clearly.

Figure 3 -Invesco MSCI Sustainable Future ETF (ERTH) Daily Candles April 23, 2021 - May 7, 2021. Source stooq.com
Now, for our premium subscribers, let’s drill down to the key levels for a potential entry and do a recap of the previous analysis. Not a Premium subscriber yet? Go Premium and receive my Stock Trading Alerts that include the full analysis and key price levels.
Thank you for reading today’s free analysis. If you would like to receive daily premium follow-ups, I encourage you to sign up for my Stock Trading Alerts to also benefit from the trading action described - the moment it happens. The full analysis includes more details about current positions and levels to watch before deciding to open any new ones or where to close existing ones.
Thank you.
Rafael Zorabedian
Trading Strategist
-
Knowing the Chief Enemies of a Trader: Part 1
May 7, 2021, 10:33 AMHas trading gotten you down? Do you feel stressed? Have you taken on too much? Then read on...
Happy Friday, and I hope today’s message finds you well! It’s my pleasure to be here with you today. I wanted to share some nuggets of experience that being a short-term trader has taught me over the years. Today, instead of delving into technicals and new trades, we’ll cover something new. I find it just as beneficial to discuss some of the things that happen to many traders and provide some perspective.
First, every trader is different. You may be a technical swing trader, a scalper, a position trader, or a day trader. So, there is no one-size-fits-all for all traders when it comes to rules. However, unless you are a robot or use automated algorithmic trading, chances are that some degree of emotion and mental exhaustion will kick in at some point during your endeavors.
For me, by the time Friday rolls around, it has been a long week of analysis, beginning on Sunday night. When I was younger, I would always trade from bell to bell, or nonstop in futures or currencies in the overnight session. Audio alerts waking me up at 3 AM when London opens, stop-loss orders getting executed overnight, losing relationships because of non-stop trading… I have seen a lot! So, some years ago, and after evaluating my performance each day of the week, I found that Friday was my worst performing day. Since, in the past, I traded heavily in futures markets (which trade around the clock), I found that mental exhaustion does kick in at a certain point (for me it’s by Thursday night) and it takes self-recognition to come to this realization, unless you have a trading partner or are part of a trading group. For you, some or none of this may apply. Perhaps you dig through company financials and charts to the point where it starts to get a little bit fuzzy. The bottom line is that we are all human beings and have a point where the body and mind need to rest. Mental exhaustion can be a killer of good traders. So, for me, I don’t often trade on Fridays. Why would I? The data tells me not to.
Furthermore, there is always the allure of overtrading. The feeling of being in a trade and the seemingly endless world of opportunities at your fingertips can be captivating. It is easy to convince yourself of a good trade opportunity when one really may not exist.
The point of trading is to make money. It is not to feel excitement or a rush. If you want an adrenaline rush, go check out your local horse racing track, skydiving jump-off point, or casino. Successful trading takes discipline, planning, and execution. There just isn’t always an optimal point or reason to enter a trade. As such, a trader should be aware of himself or herself when it comes to this aspect of the business. Sometimes, no trade is a good trade.
Believe me, the market will be there tomorrow.
In future publications, I plan to discuss many more components of market and trader psychology. Stay tuned! This is only part one.
Now, for our premium subscribers, let’s recap the key levels from yesterday’s publication. Not a Premium subscriber yet? Sign up, go Premium and receive my Stock Trading Alerts that include the full analysis and more details about current positions and key price levels to watch for before deciding to open any new positions or where to close existing ones. You’ll be able to benefit from trading actions, the moment they happen.
For our premium subscribers, yesterday created a potential favorable entry point into GRID per the analysis, and I hope that some of our readers were swift enough to take advantage of it.
Thank you.
Rafael Zorabedian
Trading Strategist
-
US Infrastructure Play: A Smarter Electrical GRID
May 6, 2021, 8:53 AMYesterday I had the pleasure of Przemek Radomski, the Founder and Editor-in-Chief of Sunshine Profits, introducing me to you as the new author of the Stock Trading Alerts. It’s a thrill to be here, and I’ll be bringing these Alerts to you daily from Monday to Thursday, with the occasional publication on Fridays dealing with subjects like trading psychology. I also invite you to check out my full bio.
So, let’s roll with today’s topic – smart grids.
Do you have exposure to smart grids in your portfolio? Many savvy investors are looking at clean energy and smart grids - and with good reason.
After the passage of the $1.9 Trillion Covid relief bill, the attention of Wall Street turned to President Biden’s $2 Trillion (with a capital T!) infrastructure plan. This massive spending plan is a partial catalyst to a potential industrial beneficiary of this plan, Electric Grid Improvements.
Smart energy and smart grids have taken on a theme in many investors’ portfolios lately. One below the radar index is the NASDAQ OMX Clean Edge Smart Grid Infrastructure Index. There is an ETF on this index (GRID), and that is our focus of analysis today. GRID targets companies involved with upgrading America’s electricity grid with new technologies and transforming the electric system into a more efficient machine. At the time of this writing, the top 5 holdings in this ETF are ABB Ltd. (SWX:ABBN), Johnson Controls International plc (NYSE:JCI), Eaton Corp. Plc (NYSE: ETN), Schneider Electric SE (EPA: SU), and Aptiv PLC (NYSE: APTV). You can take a look at the other top holdings and key data on GRID in the ETF Database.
Although this ETF does not have a ton of volume like SPY or IWM, it does have ample liquidity with an average trading volume of around 60,000 shares each day. It can provide investors with some exposure to this area, which falls under the “Quality of Life at Home” part of the infrastructure plan agenda - featuring $650 Billion of proposed investment. GRID has an 8.27% YTD return as of the time of this writing.
Now that we have a basic overview of what the GRID ETF is all about, let’s turn our attention to the technicals.
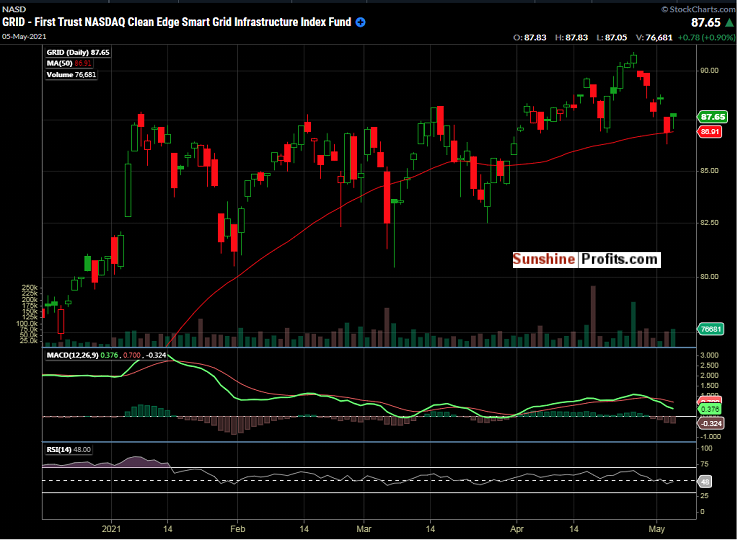
 Figure 1 -First Trust NASDAQ Clean Edge Smart Grid Infrastructure Index Fund (GRID) Daily Candles December 16, 2020 - May 5, 2021. Source stockcharts.com
Larger Chart: https://stockcharts.com/acp/?s=GRID
As we can see from our chart, GRID has been chugging along steadily higher after a price consolidation period from January to the end of March. It recently broke out above the higher end of this consolidation range and traded up to $90.96 on April 27, 2021. Since putting in this 52-week high (and all-time high), it has traded back down to; and below its previous consolidation high ($88.17). The last trade on May 5, 2021, was $87.65. GRID tested its 50-day moving average on May 4, 2021 (which was $86.85 on this day) and closed just above it, ending the session at $86.87. This indicates to me that some eyeballs were on this ETF towards the market close on May 4, 2021. Let’s take a closer look at the intraday action that formed this closing value just above the key 50-day moving average on that day.

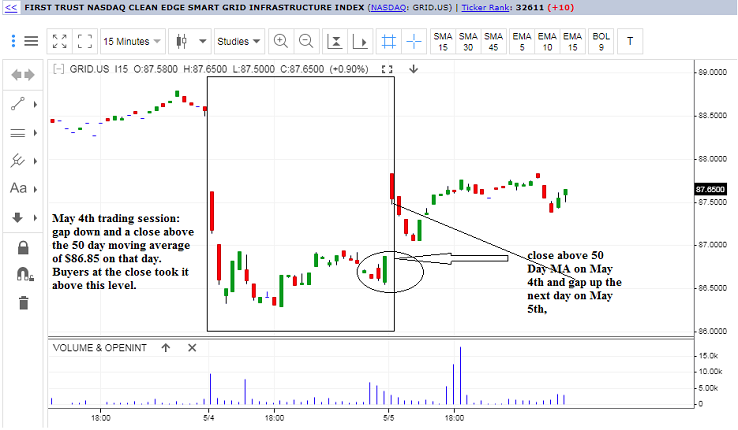
Figure 2 -First Trust NASDAQ Clean Edge Smart Grid Infrastructure Index Fund (GRID) 15 Minute Candles May 3, 2021 - May 5, 2021. Source stooq.com
Larger Chart: Here
Drilling down to the intraday 15-minute candles, we can see more clearly that there was indeed some buying during the last hour of trade on May 4, 2021, pushing the price over this 50-day moving average. When I see something like that, it tells me a picture story – it paints a technically bullish picture in the story of this ETF.
Next, I consider the previous consolidation high level of $88.17. At the time of this writing and based on May 4, 2021, close, we are currently below this level. Let’s see what the market does in the morning. Seeing how the 50-day moving average held up so well on a soft broader market session on May 4, 2021, combined with the gap up on May 5, 2021, the picture story seems to be unfolding favorably for GRID bulls.

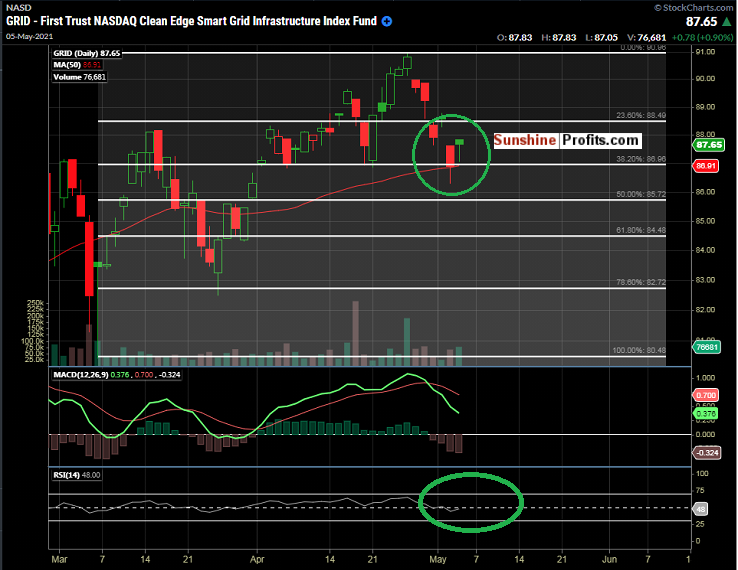
Figure 3 -First Trust NASDAQ Clean Edge Smart Grid Infrastructure Index Fund (GRID) Daily Candles December 16, 2020 - May 5, 2021. Source stockcharts.com
Larger Chart: https://stockcharts.com/acp/?s=GRID
Notice that the RSI (14) is looking to cross the 50 line to the upside. This is a bullish clue after the recent selloff. Also, notice how the 50-day moving average coincided with the 38.2% Fibonacci retracement level from the low put in on March 5, 2021, to the high of 90.96 on April 27, 2021. Combining this with the 50-day moving average test holding up successfully, this is what I like to call a “confluence of indicators.”
Thank you for reading today’s free analysis. If you would like to receive daily premium follow-ups, I encourage you to sign up for my Stock Trading Alerts to also benefit from the trading action described - the moment it happens. The full analysis includes more details about current positions and levels to watch before deciding to open any new ones or where to close existing ones.
Thank you.
Rafael Zorabedian
Trading Strategist
-
S&P 500 Shows Little Mercy for Short Sellers
May 5, 2021, 10:55 AMAvailable to premium subscribers only.
-
Stock Trading Alert – Important Message
April 30, 2021, 2:40 PMAvailable to premium subscribers only.
Free Gold &
Stock Market Newsletter
with details not available
to 99% investors
+ 7 days of Gold Alerts
Gold Alerts
More-
Status
New 2024 Lows in Miners, New Highs in The USD Index
January 17, 2024, 12:19 PM -
Status
Soaring USD is SO Unsurprising – And SO Full of Implications
January 16, 2024, 8:40 AM -
Status
Rare Opportunity in Rare Earth Minerals?
January 15, 2024, 2:06 PM

