

-
Knowing the Chief Enemies of a Trader: Part 2
May 18, 2021, 9:30 AMTen days ago, I discussed some of the enemies that are present in trader psychology, namely mental exhaustion and overtrading. Today, we will take a moment to reflect on those points, while discussing some other aspects that we all contend with during our endeavors.
In my opinion, there is no need to be constantly active in any market. To do so would mean that there are always favorable buy and sell levels. Sure, some traders are more active than others. But for the majority of discretionary traders, constant buying and selling is not possible, unless they’re scalping. Even with a scalping strategy, it is virtually impossible to compete with high-frequency trading that can only be achieved using algorithms and robots.
Again, all traders are different or have different strategy types. Some days, there may just not be any readily apparent opportunity in your given market. Do not force it! It is more or less how I feel today. We have commodities all the way up, US equity indices coming off a volatile mid-week last week that ended with a bounce to the middle of a range. At the same time, the $VIX was crushed (volume crush), and in my experience, this leads to rangebound action. That can be great if you are trading certain options strategies. Every strategy gets a turn.
As mentioned in the first part of this series, the market will be there tomorrow. Sometimes, the sidelines and just holding and/or waiting for a market to come to your desired entry or exit levels is the right move.
What about when we are not feeling well?
When we aren’t feeling well, our bodies, and therefore our minds are just not 100%. In this often-misunderstood world of trading, a high level of sharpness is required to perform at high levels. As a rule of thumb, trading is not a good idea when we don’t feel well. Even when a trader is tired, or just feels like they might be getting a cold, it may be best to avoid making important decisions. Again, the market will be there tomorrow.
When you tell someone you are an active trader, you may often be misunderstood. Many folks just do not understand the sharpness and precision that is required; to even attempt to succeed. Depending on a trader’s individual level of activity, it may take everything he has 24/7 to trade effectively. That’s a long week! Let’s be sure to tackle such a week or anything similar only when our bodies and minds are performing at the highest levels possible.
Now, for our premium subscribers, let’s recap the key levels from previous publications, including a key level in ERTH that we discussed back on May 10th. Not a Premium subscriber yet? Go Premium and receive my Stock Trading Alerts that include the full analysis and key price levels.
Thank you for reading today’s free analysis. If you would like to receive daily premium follow-ups, I encourage you to sign up for my Stock Trading Alerts to also benefit from the trading action described - the moment it happens. The full analysis includes more details about current positions and levels to watch before deciding to open any new ones or where to close existing ones.
Thank you,
Rafael Zorabedian
Stock Trading Strategist -
Blockchain Technology, S&P 500 Show Interesting Patterns
May 17, 2021, 9:43 AMDoes your portfolio contain exposure to blockchain technology? There are some interesting correlations and ways to play the sector.
I hope this message finds you coming back to business after a relaxing weekend. We needed one! Last week was a volatile one across most US equities, but in the big picture, it was just a mild pullback.
After last week's enormous CPI print, US markets will have a quieter economic data schedule this week. There is Housing Starts on Tuesday, Philly Fed Manufacturing Index, and Unemployment Claims (not the big Non-Farm Payroll number) on Thursday, along with Flash manufacturing PMI on Friday. The upcoming week is a light data week, and these metrics do not usually move the markets all that much.
First, let’s take a look at the S&P 500 and recap how it closed out the week, along with the key levels that we have been monitoring.
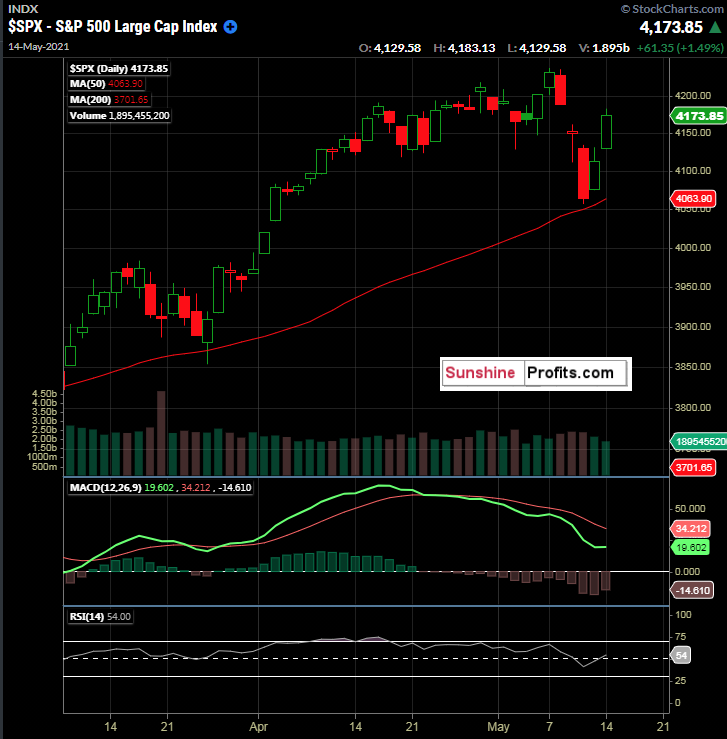
Figure 1 -S&P 500 Index Daily Candles ($SPX) March 9, 2021 - May 14, 2021. Source stockcharts.com
Here, we see how the $SPX traded lower midweek and bounced Thursday (May 13) and Friday (May 14). As we were looking for a test of the 50-day moving average, it just didn’t quite make it to the exact level before bouncing, at least not in the cash market. In the futures market, however, the June E-Mini S&P 500 Futures contract did indeed briefly break its 50-day moving average.

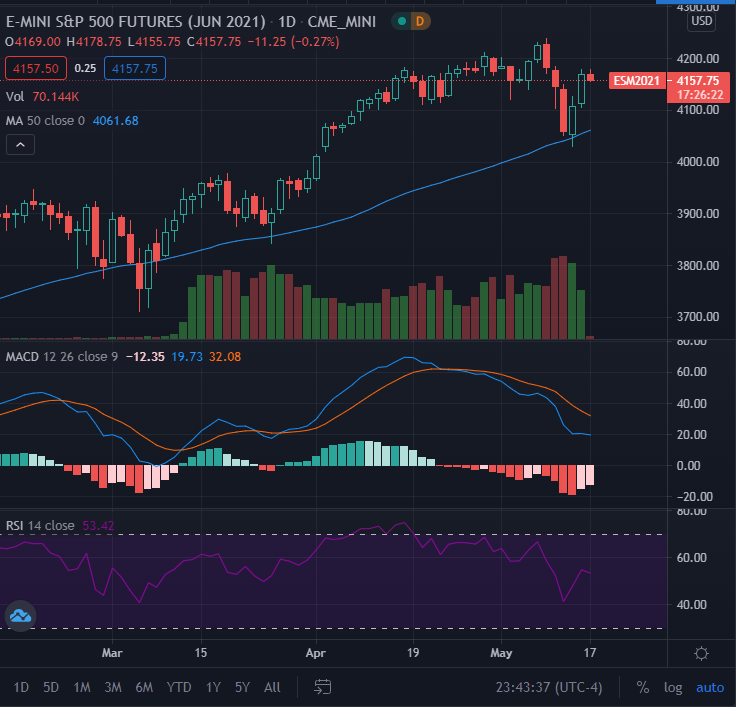
Figure 2 - E-Mini S&P 500 Futures (June 2021) Daily Candles February 9, 2021 - May 10, 2021. Source tradingview.com
This is how it goes sometimes. If you are an active trader in the index, things can happen overnight that trading in the equity product just won't provide price exposure to; and this can be a good or bad thing. The 50-day moving average was breached and then held between 4 AM - 5 AM (Eastern Standard Time) on Thursday, May 13th, 2021. Some “early bird catch the worm type” traders may have caught this and used it.
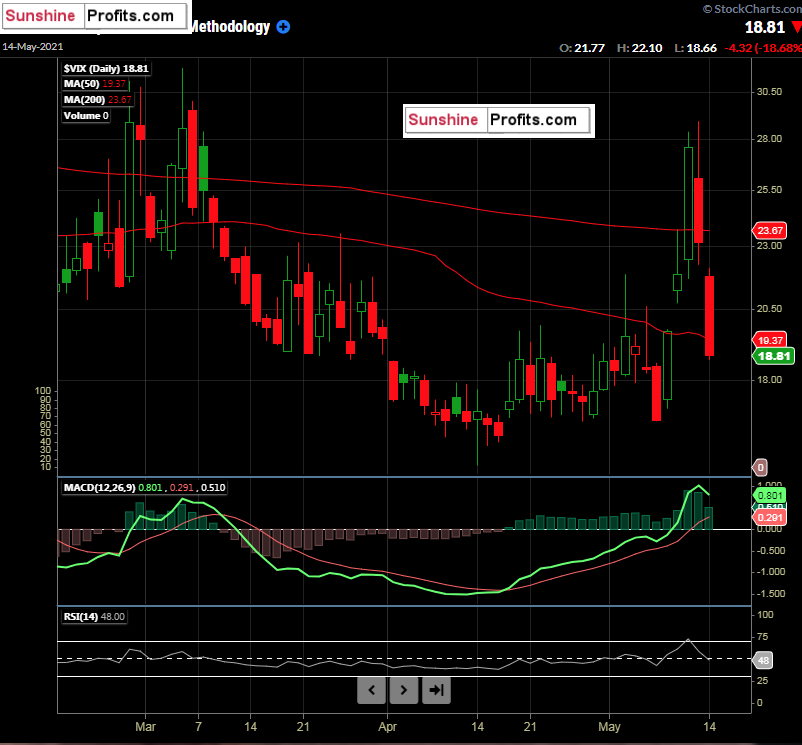
Figure 3 - $VIX Volatility Index Daily Candles February 16, 2021 - May 10, 2021. Source stockcharts.com
As the S&P 500 bounced from near its 50-day moving average on Thursday and Friday, we saw the $VIX get hammered, as traders sold volatility, sucking the volume right out of the S&P 500 options.
So, where do we go from here in the S&P 500? I will still be watching for an actual test of the 50-day moving average in the cash index. However, it feels like the market wants to trade sideways to higher in the short term. Let’s wait and see what clues develop this week.
Some futures traders may have caught the reversal in the large-cap index, and hats off if you are one of them. Since we have bounced so hard on Thursday and Friday, I turn my attention to finding other names that could be at interesting levels. Amplify Transformational Data Sharing ETF (BLOK) has been on the radar.
The BLOK ETF, which contains Paypal Holdings, MicroStrategy, Square, Voyager Digital, and Galaxy Holdings Ltd. as its Top 5 holdings, invests in blockchain businesses and the technology behind it.
As more and more companies are adopting bitcoin or other cryptocurrencies in some form in recent days, plus the pullback that bitcoin has been experiencing (down over 34% from its all-time highs), today is a good day to take a look at BLOK.
Now, for our premium subscribers, let’s dig into the BLOK technicals and revisit the existing markets that are being covered. Not a Premium subscriber yet? Go Premium and receive my Stock Trading Alerts that include the full analysis and key price levels.
Thank you for reading today’s free analysis. If you would like to receive daily premium follow-ups, I encourage you to sign up for my Stock Trading Alerts to also benefit from the trading action described - the moment it happens. The full analysis includes more details about current positions and levels to watch before deciding to open any new ones or where to close existing ones.
Thank you,
Rafael Zorabedian
Stock Trading Strategist -
US Inflation Data Creates Equity Bloodbath. What Now?
May 13, 2021, 6:58 AMHow did you react to the follow-through sea of red on Wednesday? Hopefully, your plan was already intact, and you were able to follow it.
What a difference a couple of days makes, right? As the week started out, the broader indices seemed reluctant to trickle lower in the slightest. It was up, up, up. Now, we are dealing with the Colonial Pipeline debacle in the US, Gaza Strip battles, and a huge inflation print in the US courtesy of Wednesday’s CPI data.
All of this equated to continued selling in the major US averages on Wednesday (May 12). In case you missed it, Wednesday’s US Consumer Price Index data surged far beyond market expectations, resulting in a 13-year high reading. I think this exceeding the 0.2% forecast was expected by many market participants. However, the print of 0.8% was four times the expectations, and this created some follow-through downside volatility across the board in US equities, as the US Dollar and bond yields surged.
Since we are approaching some key levels in some of the instruments that we are following, let’s recap where we sit across several of them.
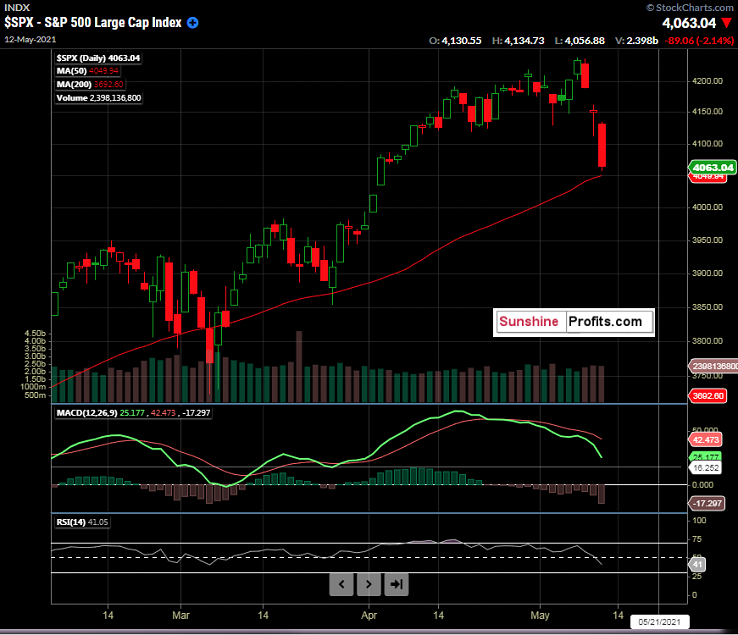
Figure 1 -S&P 500 Index Daily Candles ($SPX) February 4, 2021 - May 12, 2021. Source stockcharts.com
If you like large red candlesticks, yesterday was your day. We saw the S&P 500 ($SPX) move lower by 2.14% on the session, closing at 4063.04. Prices came very close to the 50-day moving average that we have been monitoring, but it did not pierce or close below it. There will be more on that later in the premium version of this analysis.
Next, as we were discussing yesterday, we have the Volatility Index ($VIX):
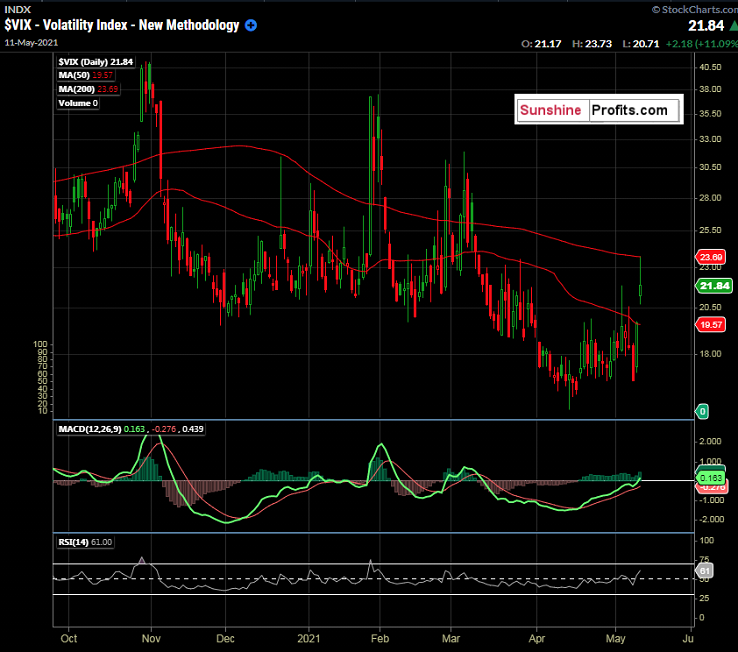
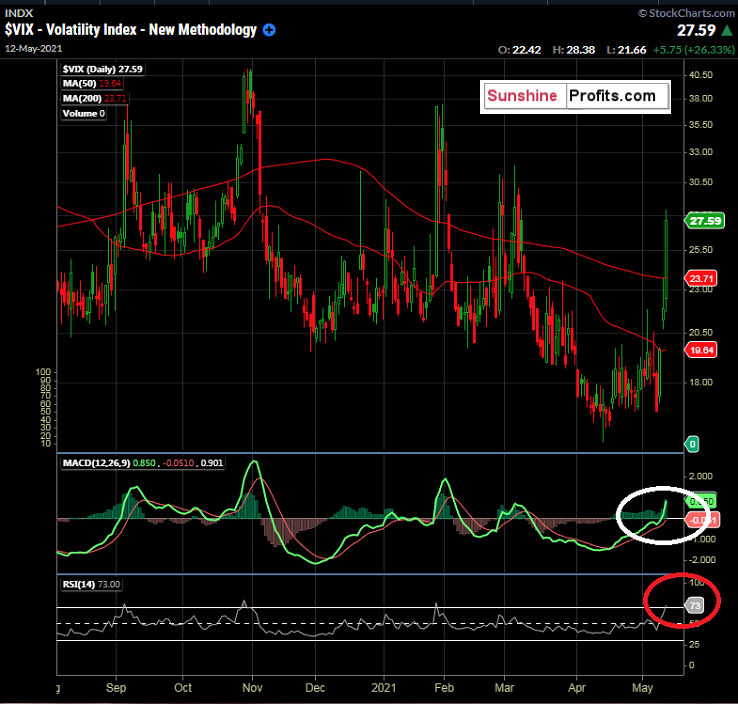 Figure 2 - $VIX Volatility Index Daily Candles August 5, 2020 - May 10, 2021. Source stockcharts.com
S&P 500 Index put buyers had a glorious day, with the $VIX surging 26.33% on the session and closing well above its 200-day moving average, as we can see above. This has been the case in the last several selloffs in the S&P 500, as we outlined yesterday. Other notes of importance on this chart include the RSI(14) nearing overbought levels with a close around 73 on the day. The MACD (12,26,9) crossed the zero line as well. Wednesday was a great session for folks long S&P puts, as the implied volatility of the options along with the options delta exploded for those trading at or near-the-money options.
As we outlined yesterday, we are still monitoring for some pattern repetition in $VIX and $SPX that we have seen in the past.

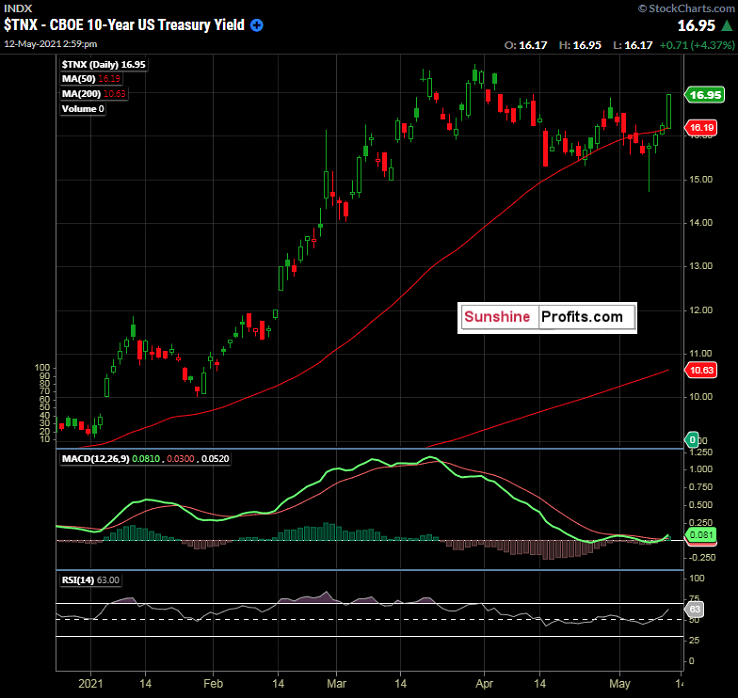
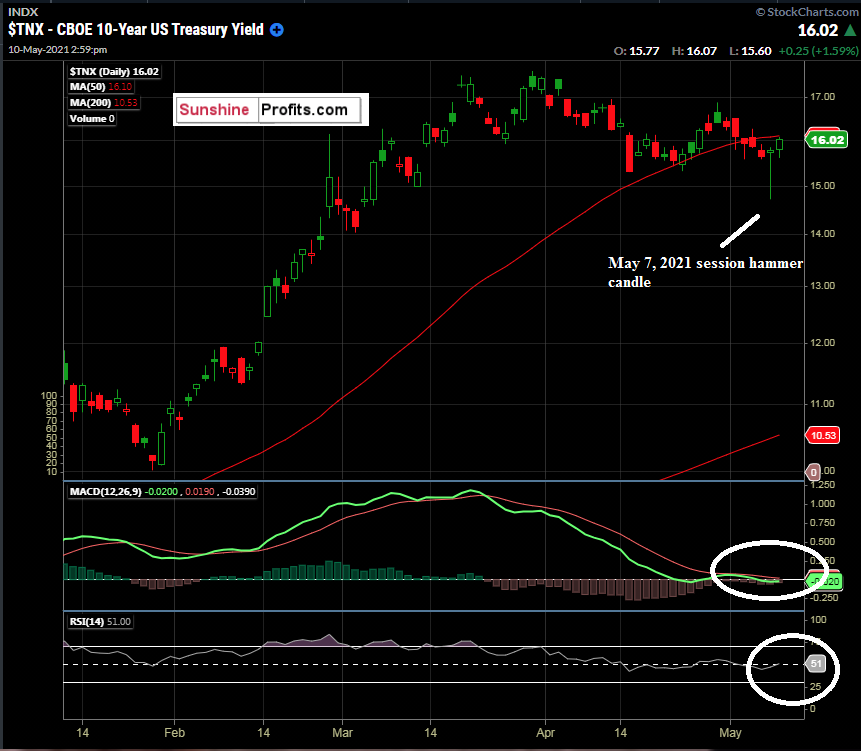
Figure 3 -CBOE 10-year US Treasury Yield Daily Candles January 12, 2021 - May 10, 2021. Source stockcharts.com
As the US Dollar rose, so did bond yields. The 10-year yield is something that we have been monitoring closely, as it can be a valuable indicator.
What will the US equity market have in store for us for the remainder of the week?
Well, for our premium subscribers, let’s drill down to the key levels for the existing markets that are being covered. Not a Premium subscriber yet? Go Premium and receive my Stock Trading Alerts that include the full analysis and key price levels.
Thank you for reading today’s free analysis. If you would like to receive daily premium follow-ups, I encourage you to sign up for my Stock Trading Alerts to also benefit from the trading action described - the moment it happens. The full analysis includes more details about current positions and levels to watch before deciding to open any new ones or where to close existing ones.
Thank you,
Rafael Zorabedian
Stock Trading Strategist -
What Can We Learn from Tuesday’s Equity Selloff?
May 12, 2021, 9:53 AMDoes Tuesday's market volatility have you scratching your head? Today, we dig into key S&P 500 & VIX levels to have on your radar.
Yesterday (May 11), the US equity markets sold off at a decent clip. As mentioned in our last two alerts, many equity products did seem short-term overbought. Monday's sell-off seemed to surprise many talking heads on television and the internet, though. I mean, markets do not go up in a straight line. There have to be some pullbacks (of at least a garden variety) for a healthy bull market to pause and reestablish itself. So, what can yesterday’s equity market sell-off tell us, and are there any foreshadowing clues to the future direction? It is time to dig in and see what we can find while recapping our existing trades and levels.

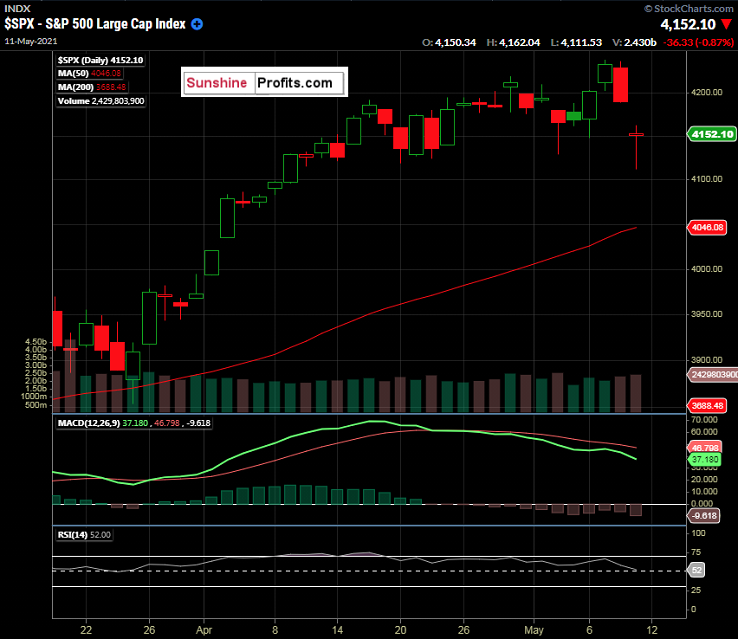
Figure 1 -S&P 500 Index Daily Candles ($SPX) January 12, 2021 - May 10, 2021. Source stockcharts.com
As we can see from the daily cable chart of the $SPX, yesterday’s session produced a large gap down and formed a doji looking reversal candle by the day’s end. The gap down really only means that the S&P 500 futures were lower overnight, but the equity traders will certainly take note of this gap. The previous lows made burying April and earlier this month held up as support during this session. What does this tell us? It’s mixed and too close to call. We are still trading well above the 50-day moving average, which sits at 4046 at the time of this writing. Since we had the gap lower, and albeit buyers arose intraday, the session closed very close to where it opened. That type of daily candle is known as a doji candle, which can be interpreted as a reversal signal, where buyers come in and gobble it up to close the session even. It is hard to call since we are still overbought by some metrics with the RSI(14) looking to cross the 50 line to the downside. Zooming out a bit on the dailies, we see the previous tests of the 50-day moving average, as mentioned in previous alerts:
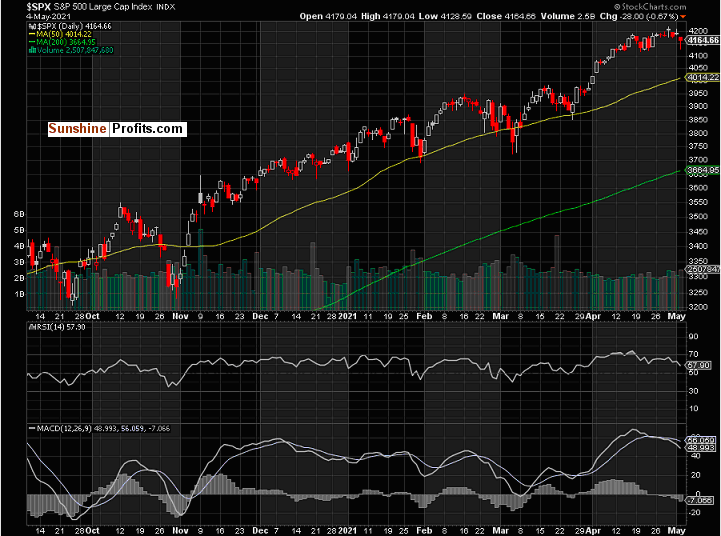
 Figure 2 - S&P 500 Index ($SPX) Daily Candles September 12, 2020 - May 4, 2021. Source stockcharts.com
We saw the 50-day moving average hold up well on two out of three of the last attempts. On the attempt where the $SPX traded through the 50-day, it caught some support just shy of the previous 50-moving average test. This pattern was very close to a double bottom formation. Looking further back, we see that in September 2020, it closed below the 50-day for 8 or 9 sessions before moving above it. The index again broke the 50-day in late October, having 7 closes below the level forming a close-to-double-bottom, before resuming its uptrend.
We’ll get back to those previous patterns and levels in a moment. When talking about S&P 500 volatility, it’s wise to make a note of what the $VIX is doing.

Figure 3 -$VIX Volatility Index Daily Candles January 12, 2021 - May 10, 2021. Source stockcharts.com
Ah, the $VIX. Those three letters strike fear into many traders, young and old. Known as the “fear index”, it is intended to provide a metric of constant, 30-day expected volatility of the S&P500 ($SPX) options (both calls and puts). Without getting too technical, it tends to move in at an inverse correlation to the $SPX, but not necessarily. When the $SPX sells off hard, the $VIX tends to rise, and therefore the calls and puts on the $SPX tend to become “more expensive” due to the increased implied options volatility.
So, we saw the $VIX rise yesterday, all the way to its 200-day moving average, where the intraday high was made. Notice the gap up, and of course, this correlates inversely to the gap down in the $SPX.
The $VIX can indeed be a tricky beast. However, we can see that the highs in the $VIX before the subsequent drops correlated to the same days that the $SPX traded below its 50-day MA, for the most part. Notice how the $VIX traded above its 200-day MA, while the $SPX traded below its 50-day MA. I love when charts and correlations paint pictures like this.
Now, for our premium subscribers, let’s drill down to the key levels to see if there could be any potential opportunities looming. Not a Premium subscriber yet? Go Premium and receive my Stock Trading Alerts that include the full analysis and key price levels.
Thank you for reading today’s free analysis. If you would like to receive daily premium follow-ups, I encourage you to sign up for my Stock Trading Alerts to also benefit from the trading action described - the moment it happens. The full analysis includes more details about current positions and levels to watch before deciding to open any new ones or where to close existing ones.
Thank you,
Rafael Zorabedian
Stock Trading Strategist -
10-Year Notes: Higher Yields Ahead?
May 11, 2021, 9:04 AMHave you been forgetting about the rising interest rate theme earlier this year? Now could be a good time to put it back on your radar and be ahead of the herd.
As I began analyzing the technicals on several markets on Sunday night, I immediately looked at 10-year notes. As mentioned yesterday, the technicals on many equity products do seem short-term overbought. So, I thought, what can the bonds (meaning 10-year notes) tell us about the current message of the market?
There’s an old saying that went around the exchanges and among market participants that the bond traders are the first to know. Many traders that focus strictly on equities or futures may often overlook the bond market. I find the 10-year note to be a great barometer to keep abreast of; and earlier this year, so did the rest of the market. However, the 10-year note yield climb frenzy has been out of the headlines recently, as the yield on the 10-year has fallen from highs made at the end of March 2021. The high yield printed around 1.77% on March 30, 2021, just above the previous high made on March 18, 2021, of 1.75%. This double topping price action has led to where we are at the time of this writing, ~ 1.60%.

Figure 1 -CBOE 10-year US Treasury Yield Daily Candles January 12, 2021 - May 10, 2021. Source stockcharts.com
Here, we are examining the 10-year note yield during its recent pullback/consolidation. This is the actual yield itself, the futures themselves trade inversely to the direction of the yield. Examining this daily chart, we see the large rise that occurred in 10-year rates during Q1 2021. Since the beginning of April, we see a sideways to lower consolidation pattern, with the yield trading below its 50-day moving average of 1.62%.
During the April Fed meeting, Fed Funds rates were kept near zero as expected. The US economy has certainly picked up steam since the lows of the pandemic. The Fed’s “easy money” theme seems to continue here with the “lower for longer” theme staying in focus. Just a quick bit about interest rates: The Fed sets the Fed Funds rate, which is the overnight lending rate that banks charge each other. The “market” itself trades all of the other interest rate products freely (10-year notes, 30-year bonds, 2-year notes. etc.). The market also trades the short-term Fed Funds rate as well in the futures market.
So, we have the Fed seeming to stick to their guns on the lower overnight lending rates. Is the message of the market the same? Let’s look at the 10-year note futures.

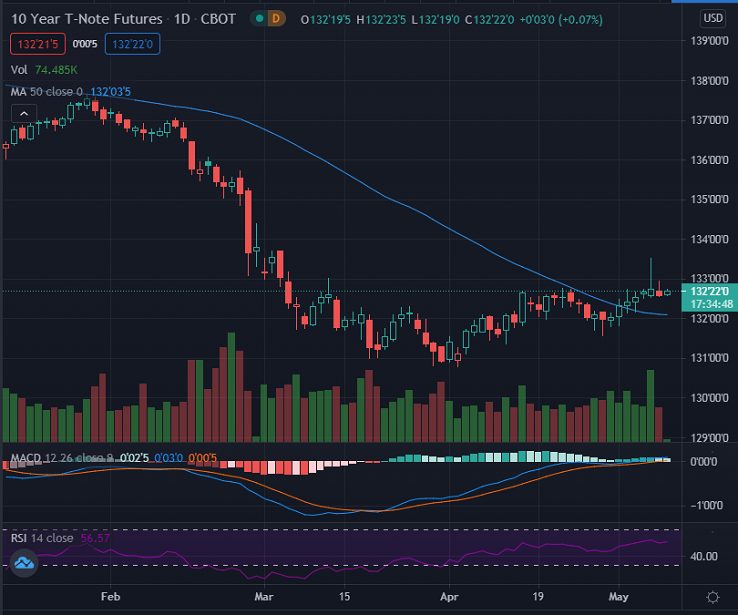
Figure 2 -10-year T-Note Futures CBOT (ERTH) Continuous Front-Month Contract Daily Candles January 12, 2021 - May 10, 2021. Source tradingview.com
Here, we will see an almost mirror inverse of the first yield chart. Remember, bond prices move inversely to yield. Several things capture my attention. The first thing is that we are trading above the 50-day moving average. Second, we have moved lower since February as rates rose frantically (at times) and have just consolidated around these levels.
An interpretation of the current market is based on one’s outlook on rates. Will rates indeed continue lower for longer? The 10-year was trading at a sub 1% yield in 2020, seemingly as a result of the pandemic. However, these are extremely low 10-year note rates historically, as we see here:

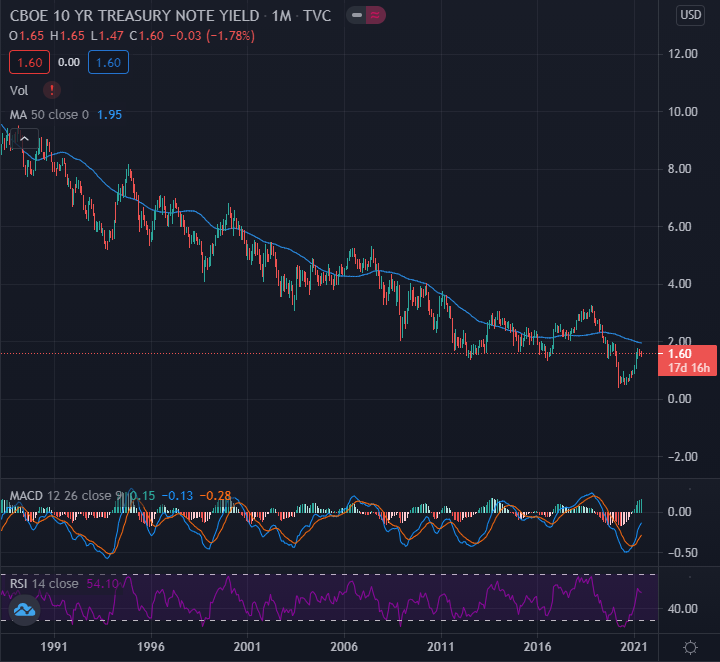
Figure 3 -CBOE 10-year US Treasury Yield Monthly Candles May 1988 - May 2021. Source tradingview.com
To be clear, I never suggest entering any short-term trade (especially in a futures market!) based on long-term charts. However, it can be beneficial to have an idea of a market’s history over time. Clearly and unsurprisingly, the 10-year note yield has been declining for quite some time. Imagine taking out a 15 or 30 mortgage at 10% - 13% or more? People did it in the 1980s! We are fortunate to be enjoying a low-interest-rate environment.
Now, for our premium subscribers, let’s drill down to the key levels to see if there could be a potential opportunity. Not a Premium subscriber yet? Go Premium and receive my Stock Trading Alerts that include the full analysis and key price levels.
Thank you for reading today’s free analysis. If you would like to receive daily premium follow-ups, I encourage you to sign up for my Stock Trading Alerts to also benefit from the trading action described - the moment it happens. The full analysis includes more details about current positions and levels to watch before deciding to open any new ones or where to close existing ones.
Thank you,
Rafael Zorabedian
Trading Strategist


Free Gold &
Stock Market Newsletter
with details not available
to 99% investors
+ 7 days of Gold Alerts
Gold Alerts
More-
Status
New 2024 Lows in Miners, New Highs in The USD Index
January 17, 2024, 12:19 PM -
Status
Soaring USD is SO Unsurprising – And SO Full of Implications
January 16, 2024, 8:40 AM -
Status
Rare Opportunity in Rare Earth Minerals?
January 15, 2024, 2:06 PM

